Sea Ice Classification using a Neural Network Algorithm for NSCAT Jun-Dong Park, W. Linwood Jones, and Josko Zec Central Florida Remote Sensing Laboratory University of Central Florida Dept. of Electrical and Computer Engineering Orlando, FL 32816 (407) 275-4350, Fax (407) 823-5835
[email protected],
[email protected],
[email protected]
Abstract - The NASA Scatterometer (NSCAT) is designed to measure wind vectors over oceans; but there are land and ice applications as well. This paper presents recent work to develop sea ice classification algorithms based on neural network technology. Multi-Layer Perceptron (MLP) neural networks are trained using multi-azimuth, dual-linear polarized normalized radar cross section measurements from Ku-band NSCAT. Algorithms are developed to classify the first-year sea ice edge in both the Arctic and Antarctic. For the Arctic region, after classifying the ice boundary, both first-year and multi-year classifications are made and expressed as multi-year fraction. NSCAT results are compared with corresponding ice products from the passive microwave Special Sensor Microwave Imager. Results show the utility of satellite scatterometers and neural network techniques for classifying sea ice in near-real time and independently of other sensors. INTRODUCTION From September 1996 to June 1997, the NASA Scatterometer, NSCAT, operated on Japan’s Advanced Earth Observation Satellite, ADEOS, and measured the surface normalized radar cross section (σ0) globally. The NSCAT geometry had measurement swaths to the right and left of the satellite sub-track. Each swath used four antenna “fan” beams to illuminate the surface at three azimuth angles and two linear polarizations. Near the poles, σ0 was measured from approximately 20° to 50° incidence angle on each beam. The forward and aft looking beams were vertical polarized and separated by 90° in azimuth. The middle beam was dual polarized and was forward of the aft beam by approximately 20° in azimuth (70° aft of the forward beam). For ice classification, only data between 30° and 50° incidence were used. NEURAL NETWORKS Neural nets have been successfully used for classifying radar backscatter from sea ice [1-3]. In this research, a supervised neural network is implemented for NSCAT because ice classifications are available from the Special Sensor Microwave Imager, SSMI, on the DMSP satellite. NSCAT data are collocated in space and time, and the SSMI
ice classifications are assigned to the NSCAT measurements to produce training data. Once the neural net has “learned” these data, independent data are presented to this net and sea ice parameters are inferred. Separate neural nets are used to classify the sea ice edge (Arctic & Antarctic) and the multiyear sea ice fraction (Arctic only) using the NSCAT radar backscatter. Results are presented for the Multilayer Perceptron (MLP) neural network implementations. SEA ICE CLASSIFICATION ICE EDGE: The basis for sea ice edge classification is the difference between first-year sea ice and ocean σ 0. For firstyear sea ice, the backscatter at Ku-band is nearly isotropic and weakly polarized, and the backscatter signature (σ 0 versus incidence angle) falls off gradually with incidence. Long [4] has shown anisotropies of ±0.5 dB and polarization ratios (vertical/horizontal σ0) of less than 2 dB. For the ocean, the sigma-0 is very dynamic (time variable) being a function of both the surface wind speed and direction. The backscatter is highly anisotropic (3 - 6 dB) and polarized (3 10 dB). Further, at incidence angles of greater than 30ϒ the σ0 signature has a great dynamic range (varies approximately logarithmically with wind speed). An MLP neural network was trained using NSCAT σ 0 following the procedure developed for the Seasat-A Satellite Scatterometer [2]. Data were collected around Antarctica from September 1996 to May 1997. First, σ0 from the forward antenna were associated with ocean or sea ice using a two step classification process. Step-1, the σ0 were classified using a modified co-polarized (vertical/horizontal) backscatter ratio algorithm by Yueh [5]. Step-2, these classifications were compared with an independent Antarctic Sea ice chart from National Snow and Ice Data Center to establish credibility. Adjustments were made in the classification where deemed necessary. The greatest difficulty occurred at the ice edge when the σ0 cell (beam footprint) was partially filled with ocean and ice. For this condition, the classification was identified as ice. In this manner, the classification of ocean was ice-free. After classifying the forward antenna, the σ 0 cells of the aft and middle antennas that were within a radius of 25 km were assigned this classification. The input variables to the neural
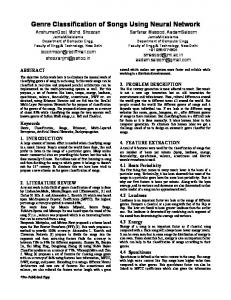
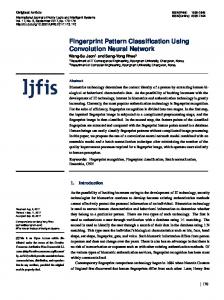
net were; the forward beam σ 0, the forward/aft σ 0 ratio (anisotropy), the vertical/horizontal σ 0 ratio (co-polarization), and the mean incidence angle the σ0 cells. Using this classification data set, the MLP net was trained, and its performance was evaluated using independent data not used for the net training. For this evaluation, independent NSCAT σ0 from both the Antarctic and Arctic regions were used to estimate the sea ice edge. These ice edge locations from NSCAT were compared to independent estimates of the sea ice edge location from corresponding SSMI observations [6]. MULTI-YEAR ICE FRACTION: Following the location of the sea ice edge, a second MLP net was trained to estimate multi-year ice fraction for the Arctic region. The input variables were identical to those of the ice-edge classification net. To provide the training set, three days (42 orbits) of NSCAT σ 0 were classified using sea ice concentration and multi-year fraction maps provided by the National Snow and Ice Data Center [7]. Collocated NSCAT σ0 were assigned the sea ice classification corresponding to their geographic location. NSCAT data from the Arctic were presented to this net and estimates of the multi-year fraction were obtained. RESULTS AND DISCUSSION SEA ICE EDGE: NSCAT measured σ0 in the polar regions from September 1996 to May 1997. Typical sea ice maps derived from NSCAT for this period are presented in Fig. 1 for the Arctic and Antarctic regions. From left to right, the images are for the following one week periods starting: 2 Oct. 1996, 3 Dec. 1996, 12 Jan. 1997, and 7 May 1997 respectively. In this figure, NSCAT ice classifications are shown shaded; and for comparison purposes, the ice edge from SSMI is presented as a series of “*”. Overall, there is excellent correlation between the ice edge locations derived for these two remote sensors; however, in the ocean region surrounding the ice there are some regions where NSCAT σ0 are misclassified as sea ice. These artifacts appear as linear “stripes” that are aligned parallel to the satellite subtrack. It is believed that this effect occurs at the lower incidence angles (30° - 35°) and under high wind speed conditions. For these ocean conditions, the NSCAT σ0 co-polarization ratio can approach that for sea ice and classification errors may result. Fortunately, these artifacts may be removed using multi-orbit σ0 correlations to eliminate these transient events. To better illustrate the NSCAT/SSMI derived ice edge comparisons, an expanded view of the Arctic is presented in Fig. 2 for the week of 2 October 1996. As before, the locations of the ice edge derived from NSCAT and SSMI are in excellent agreement. MULTI-YEAR ICE FRACTION: The NSCAT σ 0 that fell within the edge location determined above, were processed
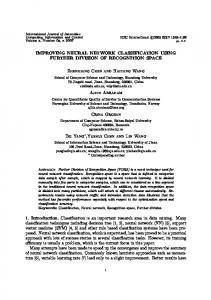
using the MPL network designed to yield multi-year ice fraction. An example of these results for the week of 2 October 1996 is shown in Fig. 3. Also shown is an image of the corresponding multiyear ice fraction derived from SSMI data [7]. The good qualitative agreement of these multi-year ice fraction contours from NSCAT and SSMI are typical of those through out the eight month period. Quantitative assessments are in progress. CONCLUSIONS Sea ice classification algorithms for NSCAT have been implemented in the form of two MLP neural networks using 0 NSCAT σ measurements over the polar regions. Excellent correlations with SSMI derived sea ice edge locations and qualitatively with multi-year ice fractions demonstrates the potential of these NSCAT algorithms for sea ice classification. Also robustness is verified by generating these sea ice products for independent sets of winter and summer season observations. ACKNOWLEDGMENTS SSMI sea ice products were provided by Remote Sensing Systems, Santa Rosa, CA and the EOS Distributed Active Archive Center (DAAC) at the National Snow and Ice Data Center, University of Colorado, Boulder, CO. This work was sponsored by the Jet Propulsion Laboratory’s NSCAT Project. REFERENCES [1] Y. Hara, R. G. Atkins, R.T. Shin, J. A. Kong, S.H. Yueh, and R. Kwok, “Application of Neural Networks for Sea Ice Classification in Polarimetric SAR Images,” IEEE Trans. Geosci. Remote Sensing, Vol. 33, pp. 740-748, May 1995. [2] S. M. Alhumaidi,, W. L. Jones, J. D. Park, and S. Ferguson, “A Neural Network Algorithm for Sea Ice Edge Classification”, IEEE Trans. Geosci. Remote Sensing, July 1997. [3] J. D. Park and W. L. Jones, “Comparison of Neural Network Classifiers for NSCAT Sea Ice Flag”, IGARSS'98 digest, Seattle, WA, July 1998. [4] D.G. Long, D.S. Early, and M.R. Drinkwater, “Enhanced resolution ERS-1 scatterometer imaging of southern hemisphere polar ice,” in Proc. Int. Geoscience and Remote Sensing Symp., Pasadena, CA, Aug. 8-12, 1994. pp. 156-158. [5] S.H. Yueh, R. Kowk, S.H. Lou and W.Y. Tsai, “Sea Ice Identification Using Dual-Polarized Ku-Band Scatterometer Data”, IEEE Trans. Geosci. Remote Sensing, May 1997. [6] Remote Sensing Systems Incorporated, Santa Rosa, CA, http://www.remss.com/ [7] National Snow and Ice Data Center, University of Colorado, Boulder, CO, http://www-nsidc.colorado.edu/
Fig.-1 Sea Ice Edge for Arctic and Antarctic regions using NSCAT neural net algorithm.
SSMI Ice
Fig.-2 Arctic sea ice edge for week of 2 October 1996 and NSCAT neural net algorithm.
SSMI MY Fraction
NSCAT MY Fraction
Fig.-3 Comparison of Arctic multi-year fraction for week of 2 October 1996.