Hindawi Publishing Corporation BioMed Research International Volume 2014, Article ID 375980, 7 pages http://dx.doi.org/10.1155/2014/375980
Research Article Simulated Annealing Based Algorithm for Identifying Mutated Driver Pathways in Cancer Hai-Tao Li,1 Yu-Lang Zhang,2 Chun-Hou Zheng,1,3 and Hong-Qiang Wang4 1
College of Information and Communication Technology, Qufu Normal University, Rizhao 276826, China College of Jia Sixie Agriculture, Weifang University of Science and Technology, Shouguang 262700, China 3 College of Electrical Engineering and Automation, Anhui University, Hefei 230000, China 4 Intelligent Computing Lab, Hefei Institute of Intelligent Machines, Chinese Academy of Sciences, Hefei 230000, China 2
Correspondence should be addressed to Chun-Hou Zheng;
[email protected] Received 20 March 2014; Accepted 13 May 2014; Published 26 May 2014 Academic Editor: Bairong Shen Copyright © 2014 Hai-Tao Li et al. This is an open access article distributed under the Creative Commons Attribution License, which permits unrestricted use, distribution, and reproduction in any medium, provided the original work is properly cited. With the development of next-generation DNA sequencing technologies, large-scale cancer genomics projects can be implemented to help researchers to identify driver genes, driver mutations, and driver pathways, which promote cancer proliferation in large numbers of cancer patients. Hence, one of the remaining challenges is to distinguish functional mutations vital for cancer development, and filter out the unfunctional and random “passenger mutations.” In this study, we introduce a modified method to solve the so-called maximum weight submatrix problem which is used to identify mutated driver pathways in cancer. The problem is based on two combinatorial properties, that is, coverage and exclusivity. Particularly, we enhance an integrative model which combines gene mutation and expression data. The experimental results on simulated data show that, compared with the other methods, our method is more efficient. Finally, we apply the proposed method on two real biological datasets. The results show that our proposed method is also applicable in real practice.
1. Introduction Cancer is a fatal disease which is extremely complex. Researchers have found that cancer should be arisen by singlenucleotide mutations, larger copy-number aberrations, or structural aberrations [1]. The dreadful feature of cancer cells is infinite proliferation. These abnormal cells can spread to other tissues through blood circulation or lymphatic system [2]. Hence, cancer is very difficult to be treated. Clinical diagnostics, prognostics, and targeted therapeutics of cancer need across-the-board comprehending molecular mechanisms of cancer cells. One of the remaining challenges is to distinguish functional mutations vital for cancer development, which is so-called “driver mutations,” and filter out the unfunctional and random “passenger mutations” [3]. With the development of next-generation DNA sequencing technologies, large-scale cancer genomics projects have been implemented to help researchers to identify driver genes, driver mutations, and driver pathways which promote cancer
proliferation in large numbers of cancer patients [4–6]. Hence, it is necessary to find efficient methods for identifying mutated driver pathways in cancer cells, which can be further used to aid in designing effective drugs to treat cancer [7, 8]. In the past years, in gene level, several studies have been devoted to predict driver mutation with significantly higher mutation rate than background mutation rate in a large cohort of cancer patients. These methods have detected several gene mutations in cancer progression. However, even cancer genomes from the same type of cancer, no two genomes exhibit exactly the same complement of somatic aberrations. In other words, these approaches cannot capture the heterogeneity of genome mutations [9, 10]. As it is well known, same pathway may result from different genome aberrations [11, 12]. Hence, it is significant to study gene in pathway level, rather than in gene level. In pathway level, it is easy to capture the heterogeneous phenomenon in cancer cells [13, 14]. Until now, most of the studies analyze known pathway for enrichment of somatic mutations [9, 10,
2 15]. Though several pathways find out significantly perturbed genes [16–18], unfortunately, knowledge of pathways remains incomplete, and many pathway databases contain overlap and unavailable data. Therefore, taking into account these obvious limitations, it is indispensable to develop de novo discovery of mutated driver pathways without relying on prior knowledge. In the whole genome, there are a huge number of gene sets if testing exhaustively. For instance, there are more than 1026 sets of seven human genes [19]. Therefore, testing all the groups up to a reasonable size seems implausible. However, in recent years, several studies have provided some methods to solve this problem [12, 20]. In these studies, the researchers find that there are two constraints on combinatorial patterns of mutations in cancer. First, generally, a driver mutation is rare. Particularly, researchers find that a single mutation is frequently enough to perturb one way. In other words, there is a phenomenon of mutual exclusivity between driver mutations. Second, a significant cancer pathway should cover a great majority of patients. Thus, the mutations should be contained by most patients in the pathway. This property is called high coverage. Lately, based on these two constraints, Vandin et al. [19] proposed a new and effective method, which defined a novel scoring function using the above two properties to detect the mutated driver pathway using the cancer data detected by next-generation DNA sequencing technologies. They defined the maximization of this method as the maximum weight submatrix problem. However, this problem is computationally difficult to solve. In order to solve this problem, in this paper, based on GA method introduced by Zhao et al. [21], we propose the simulated annealing hybrid genetic algorithm (SAGA) method for mutated driver pathway detecting. In particular, we incorporate the gene expression data to improve GA to detect mutated driver pathway, and the experimental results on both simulated and real data show that the proposed method is effective. The rest of this paper is organized as follows. In Section 2, some materials and methods used throughout this paper are introduced. Then, in Section 3, to test the efficiency of our methods, we apply our methods onto simulated data and two biological datasets. The results show that our methods are more efficient. Finally, we draw our conclusions in Section 4.
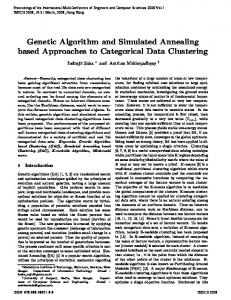
2. Materials and Methods 2.1. A Brief Introduction. Identifying driver pathway is extremely difficult. Considering this point, some researchers transformed this problem into maximum weight submatrix problem using two criteria [19], that is, “high coverage” and “high exclusivity.” However, this problem is NP-hard. In other words, no algorithm efficient in every case awaits a satisfactory result. Hence, many researchers use stochastic search methods to solve this problem. Particularly, Vandin et al. [19] proposed a method using these two properties (Figure 1). The first one is “high coverage,” which means the majority of samples have at least one mutation in driver pathway; the second one is “high exclusivity,” which means that lots of samples have no more than one mutation in one
BioMed Research International Genomes Mutation matrix
Maximum weight submatrix (k = 2) Somatic mutation Mutated Not mutated
Figure 1: Somatic mutations in samples (patients) are represented in a mutation matrix.
driver pathway. They reflect these two properties using a mutation matrix and a scoring function. A binary mutation matrix 𝐴 is constructed by 𝑚 rows (samples) and 𝑛 columns (genes). The maximum weight submatrix problem is defined as selecting a submatrix 𝑀 of size 𝑚×𝑘 in the mutation matrix 𝐴 by calculating maximizing the scoring function: 𝑊 (𝑀) = |Γ (𝑀)| − 𝜔 (𝑀) = 2 |Γ (𝑀)| − ∑ Γ (𝑔) , 𝑔∈𝑀
(1)
where Γ(𝑔) = {𝑖 : 𝐴 𝑖𝑔 = 1} denotes that gene 𝑔 in 𝑖th row (sample) is mutated. Γ(𝑀) = ⋃𝑔∈𝑀 Γ(𝑔) represents the set of patients, in which at least one of the genes in 𝑀 is aberrations. So, |Γ(𝑀)| indicates the coverage of 𝑀 ⋅ 𝜔(𝑀) = ∑𝑔∈𝑀 |Γ(𝑔)| − |Γ(𝑀)| denotes the coverage overlap weight. In order to solve this problem, Vandin et al. [19] proposed the Markov chain Monte Carlo (MCMC) method. After that, Zhao et al. [21] used the genetic algorithm (GA) to solve this problem and achieved good experimental results. However, to avoid tripping in a local solution, local search method proposed by them is not good enough to solve this problem. 2.2. Simulated Annealing Hybrid Genetic Algorithm (SAGA). As Zhao et al. [21] discussed, the genetic algorithm (GA) is a stochastic and powerful technique that can be effective in solving the maximum weight submatrix problem. However, there is a phenomenon called “premature” that maybe appear in the optimal solutions of GA. In other words, the result may be trapped in a local solution. Taking into account this situation, in this paper, we propose to use simulated annealing hybrid genetic algorithm (SAGA) to solve this problem. Simulated annealing (SA) as an optimization and heuristic algorithm mimics certain thermodynamic principles of producing an ideal crystal, which solve large-scale optimization problems in order to achieve a global optimal solution [22]. SA has been widely used in operational research problems. For example, Chu et al. [23] used SA to analyze the network
BioMed Research International
3 Mutation matrix genes
Global solution
Expression matrix genes 2.5 2.0 1.5 1.0 0.5 0 0.5 1.0 1.5 2.0 2.5
If p = e(W(M )−W(M))/T
W(M ) < W(M)
Local solution
Patients
Thick red arrow If p = 1 W(M ) < W(M) Thin blue arrow
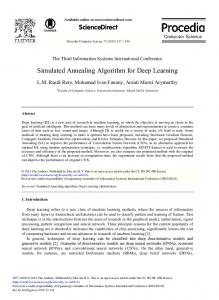
Figure 2: Simulated annealing: escape from local maximum solution.
of interacting genes. They detected the genes which control embryonic development and other biological processes. The details of our implementation, named simulated annealing hybrid genetic algorithm (SAGA), for the maximum weight submatrix problem based on SA are described as follows. Step 1. Initialize the temperature 𝑆0 . Step 2. Use GA method to generate initial solution submatrix 𝑀, and generate the scoring function 𝑊(𝑀). Step 3. Using GA method to generate a new solution submatrix 𝑀 , in the neighborhood of current solution 𝑋, reevaluate the scoring function 𝑊(𝑀 ). Step 4. If the generated solution submatrix scoring 𝑊(𝑀 ) is larger than former 𝑊(𝑀), put 𝑀 = 𝑀 . Update the existing optimal solution and go to Step 6. Step 5. Else accepts 𝑀 with probability Δ𝑆/𝑇
𝑝=𝑒
,
Mutated Not mutated
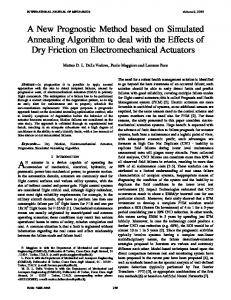
Figure 3: Illustration of the advantage of the integrative model. It utilizes the phenomenon that the expression profiles of gene pairs in same pathway have stronger correlations than those in different pathways to detect the driver mutation pathways. In blue dashed box, the genes have very weak expression correlations between each other, while, in the blue real line box, the genes with approximate exclusivity are strongly correlated with each other.
occur. Taking into account this situation, Zhao et al. [21] proposed a new method called integrative model to deal with this problem. Their new method is based on a phenomenon: the expression profiles of gene pairs in same pathway have stronger correlations than that in different pathways (Figure 3). Hence, they combine the mutation submatrix and the gene expression data, which can distinguish the same score for selecting mutation pathway. They define the integrative model function as follows: 𝐹ME = 𝑊 (𝑀) + 𝜆 ∗ 𝑅 (𝐸𝑀) ,
(2)
where Δ𝑆 = 𝑊 (𝑀 ) − 𝑊 (𝑀) .
Mutually exclusive Gene set with gene set with weak approximate correlations (k = 3) exclusivity, but strong correlations (k = 3)
(3)
If the solution is accepted, then 𝑀 = 𝑀 . Update the existing optimal solution. Step 6. Decrease the temperature periodically. Step 7. Repeat Step 2 through 6 until stopping criterion is met. Figure 2 shows the process of SA. It can be seen clearly that we can solve the global maximum solution by using SA.
(4)
where 𝑅(𝐸𝑀) = ∑𝑗1 ≠ 𝑗2 (|pcc(𝑥𝑗1 , 𝑥𝑗2 )|/(𝑘(𝑘 − 1)/2)), 𝐸𝑀 is the gene expression submatrix which corresponds to the same gene set with the mutation submatrix 𝑀, and pcc(⋅) is the Pearson correlation coefficient. 𝑥𝑗1 and 𝑥𝑗2 are the expression data, which correspond to 𝑗1 and 𝑗2 in 𝐸𝑀. Therefore, 𝑅(𝐸𝑀) is an additional term which enhances the biological correlation. 𝜆 is a coefficient. When 𝜆 = 1, 𝐹ME will distinguish driver mutation from the same 𝑊(𝑀). When 𝜆 ≥ 1, 𝐹ME will detect the gene set with high correlation and exclusivity. In our study, we set 𝜆 = 1 and 𝜆 = 10. We apply SAGA into the integrative model, and it is more efficient compared with GA method for solving the maximum weight submatrix problem.
3. Results 2.3. Integrating with Gene Expression Data. In biology, generally, there is noise and/or other factors contained in the data. On the other hand, multiple optimal solutions maybe
We first tested the ability of the SAGA to detect the set 𝑀 of maximum weight submatrix and compared the result with the MCMC and GA methods.
4
BioMed Research International 103
Time (s)
102
101
100 1000 2000 3000 4000 5000 6000 7000 8000 9000 10000 n MCMC GA SAGA
Figure 4: Comparison of computational time of SAGA, GA, and MCMC in terms of gene number from 1000 to 10000. In this plot, we use semilog coordinate (the 𝑦-axis) to show the computational time in seconds. All the makers correspond to the results of an average over 10 times.
3.1. Simulation Study. We adopt the method represented by Zhao et al. [21]. The details of their implementation of simulated mutation data start with five gene sets 𝑀1 , 𝑀2 , . . . , 𝑀𝑘 . Each set has 𝑘 members (𝑘 = 5 has been used in this study). For each row, we set the number to 1 (chosen uniformly at random) in 𝑀𝑖 (𝑖 = 1, 2, . . . , 5) with probability 𝑝𝑖 (𝑝𝑖 = 1 − 𝑖 ⋅ Δ, Δ = 0.05 has been used in this study), and if gene is 1 already, after that, with probability 𝑝0 we set the others to 1 in 𝑀𝑖 (𝑝0 = 0.04 has been used in this study). We can see that 𝑝𝑖 indicates the coverage of 𝑀𝑖 and 𝑝0 indicates exclusivity of 𝑀𝑖 . The others in 𝑀𝑖 are mutated using a random model based on the observed characteristics of the glioblastoma data. This is the background mutation rate in 𝑀. We have compared the time complexity of MCMC, GA, and SAGA on selecting the submatrix of maximum weight (Figure 4). From this picture, we can see clearly that the GA is faster than MCMC when 𝑛 is less than about 5000. Particularly, SAGA is always faster than GA from 𝑛 = 1000 to 𝑛 = 10000. In fact, it is well know that, for almost all of real applications, the 𝑛 is smaller than 5000. On the other hand, the results of SAGA are the same as GA method; that is, they can both detect the five pathways. Then we use an exact approach to test the accuracy of these methods, which is called binary linear programming (BLP) model proposed by Zhao et al. [21]. We run the BLP method to compare MCMC and GA performance with SAGA. After processing the data, the accuracy of GA and SAGA is equal, which is 95%, but higher than that of MCMC, which is 44%. In summary, our SAGA method has competitive efficiency with GA and MCMC. 3.2. Biological Applications. In this subsection, we applied our SAGA method onto lung adenocarcinoma and glioblastoma datasets. It needs to be emphasized that we consider the
mutations in the same samples as one “metagene.” We use this criterion when we solve the maximum weight submatrix problem for further analysis. Using the same methods as Zhao et al. [21], we adopt the permutation test to assess the significance of the identified gene patterns. Not only do we get “best” results, but also we check the second optimal patterns, which move the “optimal” submatrix and then detect the “optimal” results in the new matrix. We first apply our SAGA method onto lung adenocarcinoma. Comparing with GA method, we found that both of them can get the exact same “optimal” submatrix. However, the time using our method is less than that of GA. Afterwards, we apply SAGA-integrative model onto mutation matrix and gene expression matrix of glioblastoma. Compared with the integrating method in Zhao et al., like the former experiment, our method has the same results but using less time. 3.2.1. Lung Adenocarcinoma. We applied our SAGA method to analyzing a dataset of 1013 somatic mutations identified in 188 lung adenocarcinoma patients’ 623 sequenced genes from the Tumor Sequencing Project [9]. According to statistics, there are 365 genes mutated in at least one patient. We run the SAGA for sets of size 2 ≤ 𝑘 ≤ 10. After running this algorithm, when 𝑘 = 2, the pair EGFR and KBAS is the maximum weight submatrix. When 𝑘 = 3, the most significant triplet is EGFR, KRAS, and STK11. When 𝑘 ≥ 4, all sets are sampled with frequency < 0.3%. Then we perform a permutation test, as described in Vandin et al. [19]. The 𝑃 value obtained is 0.018, which is larger than that of the triplet (EGFR, KRAS, and STK11). In other words, the triplet (EGFR, KRAS, and STK11) is at least as significant as the pair (EGFR and KRAS). In biology, we find that EGFR, KRAS, and STK11 are all involved in the pathway of mTOR (Figure 5). In Ding et al. [9], the mTOR pathway is very important for lung adenocarcinoma. Hence, our method can seek out driver pathway. We remove the above three genes and apply the method to detect the additional gene sets. On the remaining genes, when 𝑘 = 2, we identify the gene set (ATM, TP53) that is mutated with frequency 56% and find that the weight of the pair is significant (𝑃 < 0.01). Previous studies have shown that both ATM and TP53 are in the cell cycle checkpoint control and direct interaction [24, 25] (Figure 6). 3.2.2. Glioblastoma. We next analyzed a collection of somatic single-nucleotide mutations and gene expression profiles identified from 206 glioblastoma multiforme samples from The Cancer Genome Atlas [15]. After processing these data, we established two matrices, that is, a mutation matrix and an expression matrix, which cover 90 samples and 1126 genes. Firstly, we discover the mutation pattern only depending on the mutation matrix. When 𝑘 = 2, we identify gene pairs (CDKN2A and TP53), and the other is CDK2B and one “metagene” containing TSPAN31 and CDK4. However, using previous methods to solve the original maximum weight submatrix problem, we cannot solve this problem, because there are two same score “optimal” gene sets. Then, we apply integration model onto these “optimal gene sets.” Running
40
40
60
60
80
80
100
120
140
140
160
160
180
180
GRIA2
PIK3CA
PIK3R1
20 30
100
120
EGFR
PTEN 10
Patients
20
TP53
ATM
STK11
KRAS
5
20
Patients
Patients
EGFR
BioMed Research International
40 50 60 70 80 90
Exclusive mutation Cooccurring mutation No mutation
Exclusive mutation Cooccurring mutation No mutation
Figure 7: The high weight submatrix of “optimal” gene set after moving the sets (PTEN, EGFR, PIK3R1, PIK3CA, and GRIA2) in glioblastoma data.
Figure 5: The high weight submatrices of the “optimal” gene set in the lung adenocarcinoma data. In this picture: red, exclusive mutation; blue, cooccurring mutation; white, no mutation. It is similar to Figure 7.
EGFR
RAS
PI3K Protein synthesis
Cell death
ATM
MDM2
TP53
AKT
TSC1/2
STK11
mTOR
Figure 6: In mTOR signaling pathway, there is the triplet of genes codes for proteins (orange nodes), and the pair (ATM and TP53) corresponds to interacting proteins in the cell cycle pathway (light blue nodes). These two pathways are reported in Ding et al. [9].
the process of integrative method with mutation matrix and gene expression matrix, we find that the correlation between CDK4 and CDKN2B has high score compared to that between TSPAN31 and CDK4. In other words, CDK4 is stronger correlation than TSPAN31 with CDK2B. In biological research, we find that the genes CDK4, CDKN2B are part of RB signaling pathway; however, there is no evidence to discover the relation between TSPAN31 and CDKN2B. In another point of view, it proves the advantages of integrative method. When 𝑘 = 3, the optimal solution is CDK4, CDKN2B, and RB1. After that, we perform a permutation test, as described in Vandin et al. [19]. We find that the triplet
EGFR
RTK/RAS /PI(3)K signaling pathway
PI(3)K
GRIA2
PTEN
Figure 8: The genes sets (PTEN, EGFR, PIK3R1, and PIK3CA) are involved in the RTK/RAS/PI(3)K signaling pathway, which is reported in TCGA [15].
(RB1, CDKN2B, and CDK4) is more significant than the pair (CDK4 and CDKN2B). We remove these five genes (RB1, CDKN2A, CDKN2B, CDK4, and TP53) from the mutation matrix and then apply SAGA to discover the others genes. When 𝑘 = 5, the optimal result is PTEN, EGFR, PIK3R1, PIK3CA, and GRIA2, which is significant in the other solutions (Figure 7). The set (PTEN, EGFR, PIK3R1, and PIK3CA) is all part of RTK/RAS/PI(3)K signaling pathway (Figure 8). In biology, gene GIRA2 is very important in glioma cells [26, 27].
4. Discussion and Conclusion In bioinformatics, it is important to detect mutated driver pathway in cancer cells. In this paper, we introduce an algorithm for discovering mutated driver patterns de novo using somatic mutation data from biological datasets, which
6 is based on recent exploration made by Vandin et al. [19] and Zhao et al. [21]. We proposed an optimization and heuristic algorithm, that is, simulated annealing hybrid genetic algorithm, which is named SAGA. By means of simulation study, we proved that our SAGA method had completive efficiency with GA and MCMC. Then, we applied our method onto lung adenocarcinoma and glioblastoma. Particularly, we considered incorporating the gene expression data into SAGA method to improve its performance, which achieved satisfactory results. Not only are the results the same as GA, but also the arithmetic speed of SAGA is faster than that of GA. Although the proposed method can find mutated driver pathway without relying on prior knowledge, we should note that the assumption of high exclusivity and high coverage is too strict for selecting the driver pathway. In biological application, mutual exclusivity is a fairly strong assumption, which holds only for driver mutations in the same pathway. It is well known that driver mutations may be caused by multiple pathways, such as cooccurring and possibly cooperative. For example, acute myeloid leukemia is caused by CBF translocations and kinase mutations [28]. So, we emphasize that assumption of mutual exclusivity occurs only in the same driver pathway. In the future, we will study the biological data, such as DNA methylation and copy-number variant (CNV), exploring the regular pattern of cooccurring and the other mutated driver pathways.
Conflict of Interests The authors declare that there is no conflict of interests regarding the publication of this paper.
Acknowledgments This work was supported by the National Science Foundation of China under Grant nos. 61272339, 61271098, and 61374181 and the Key Project of Anhui Educational Committee under Grant no. KJ2012A005.
References [1] D. Hanahan and R. A. Weinberg, “The hallmarks of cancer,” Cell, vol. 100, no. 1, pp. 57–70, 2000. [2] I. J. Fidler, “The pathogenesis of cancer metastasis: the “seed and soil” hypothesis revisited,” Nature Reviews Cancer, vol. 3, no. 6, pp. 453–458, 2003. [3] C. Greenman, P. Stephens, R. Smith et al., “Patterns of somatic mutation in human cancer genomes,” Nature, vol. 446, pp. 153– 158, 2007. [4] E. R. Mardis and R. K. Wilson, “Cancer genome sequencing: a review,” Human Molecular Genetics, vol. 18, no. 2, pp. R163– R168, 2009. [5] International cancer genome consortium, “International network of cancer genome projects,” Nature, vol. 464, pp. 993–998, 2010. [6] M. Meyerson, S. Gabriel, and G. Getz, “Advances in understanding cancer genomes through second-generation sequencing,” Nature Reviews Genetics, vol. 11, no. 10, pp. 685–696, 2010.
BioMed Research International [7] J. B. Overdevest, D. Theodorescu, and J. K. Lee, “Utilizing the molecular gateway: the path to personalized cancer management,” Clinical Chemistry, vol. 55, no. 4, pp. 684–697, 2009. [8] C. Swanton and C. Caldas, “Molecular classification of solid tumours: towards pathway-driven therapeutics,” British Journal of Cancer, vol. 100, no. 10, pp. 1517–1522, 2009. [9] L. Ding, G. Getz, D. A. Wheeler et al., “Somatic mutations affect key pathways in lung adenocarcinoma,” Nature, vol. 455, pp. 1069–1075, 2008. [10] S. Jones, X. Zhang, D. W. Parsons et al., “Core signaling pathways in human pancreatic cancers revealed by global genomic analyses,” Science, vol. 321, no. 5897, pp. 1801–1806, 2008. [11] W. C. Hahn and R. A. Weinberg, “Modelling the molecular circuitry of cancer,” Nature Reviews Cancer, vol. 2, no. 5, pp. 331– 341, 2002. [12] B. Vogelstein and K. W. Kinzler, “Cancer genes and the pathways they control,” Nature Medicine, vol. 10, no. 8, pp. 789–799, 2004. [13] S. M. Boca, K. W. Kinzler, V. E. Velculescu, B. Vogelstein, and G. Parmigiani, “Patient-oriented gene set analysis for cancer mutation data,” Genome Biology, vol. 11, no. 11, article R112, 2010. [14] S. Efroni, R. Ben-Hamo, M. Edmonson, S. Greenblum, C. F. Schaefer, and K. H. Buetow, “Detecting cancer gene networks characterized by recurrent genomic alterations in a population,” PLoS ONE, vol. 6, no. 1, Article ID e14437, 2011. [15] The Cancer Genome Atlas Research Network (TCGA), “Comprehensive genomic characterization defines human glioblastoma genes and core pathways,” Nature, vol. 455, pp. 1061–1068, 2008. [16] M. Kanehisa and S. Goto, “KEGG: kyoto encyclopedia of genes and genomes,” Nucleic Acids Research, vol. 28, no. 1, pp. 27–30, 2000. [17] L. J. Jensen, M. Kuhn, M. Stark et al., “STRING 8—a global view on proteins and their functional interactions in 630 organisms,” Nucleic Acids Research, vol. 37, no. 1, pp. D412–D416, 2009. [18] T. S. Keshava Prasad, R. Goel, K. Kandasamy et al., “Human protein reference database—2009 update,” Nucleic Acids Research, vol. 37, no. 1, pp. D767–D772, 2009. [19] F. Vandin, E. Upfal, and B. J. Raphael, “De novo discovery of mutated driver pathways in cancer,” Genome Research, vol. 22, no. 2, pp. 375–385, 2012. [20] C.-H. Yeang, F. McCormick, and A. Levine, “Combinatorial patterns of somatic gene mutations in cancer,” FASEB Journal, vol. 22, no. 8, pp. 2605–2622, 2008. [21] J. Zhao, S. Zhang, L.-Y. Wu, and X.-S. Zhang, “Efficient methods for identifying mutated driver pathways in cancer,” Bioinformatics, vol. 28, no. 22, pp. 2940–2947, 2012. [22] R. Sharda, S. Vob, D. L. Woodruff, and A. Fink, Optimization Software Class Libraries, Springer, Berlin, Germany, 2003. [23] K.-W. Chu, Y. Deng, and J. Reinitz, “Parallel simulated annealing by mixing of states,” Journal of Computational Physics, vol. 148, no. 2, pp. 646–662, 1999. [24] K. K. Khanna, K. E. Keating, S. Kozlov et al., “ATM associates with and phosphorylates p53: mapping the region of interaction,” Nature Genetics, vol. 20, no. 4, pp. 398–400, 1998. [25] N. H. Chehab, A. Malikzay, M. Appel, and T. D. Halazonetis, “Chk2/hCds1 functions as a DNA damage checkpoint in G1 by stabilizing p53,” Genes and Development, vol. 14, no. 3, pp. 278– 288, 2000. [26] F. Beretta, S. Bassani, E. Binda et al., “The GluR2 subunit inhibits proliferation by inactivating Src-MAPK signalling and induces
BioMed Research International apoptosis by means of caspase 3/6-dependent activation in glioma cells,” European Journal of Neuroscience, vol. 30, no. 1, pp. 25–34, 2009. [27] S. Maas, S. Patt, M. Schrey, and A. Rich, “Underediting of glutamate receptor Glur-B mRNA in malignant gliomas,” Proceedings of the National Academy of Sciences of the United States of America, vol. 98, no. 25, pp. 14687–14692, 2001. [28] K. Deguchi and D. G. Gilliland, “Cooperativity between mutations in tyrosine kinases and in hematopoietic transcription factors in AML,” Leukemia, vol. 16, no. 4, pp. 740–744, 2002.
7