Multiresolution for Geometric Modelling, N. A. Dodgson, M. S. Floater, and M. A. Sabin ... Multispectral Imagery and Laser Scanning Data. Geoinformatics, vol. 5,.
Data Mining VIII: Data, Text and Web Mining and their Business Applications
35
Three dimensional terrain data compression using second generation wavelets B. Pradhan & S. Mansor Institute for Advanced Technologies (ITMA), Faculty of Engineering, University Putra Malaysia, Malaysia
Abstract Terrain data such as Light Detection and Ranging (LiDAR) compression has been an active research field for the last few years because of its large storage size. When LiDAR has a large number of data points, the surface generation represented by interpolation methods may be inefficient in both storage and computational requirements. This paper presents a newly developed compression scheme for the LiDAR data based on second generation wavelets. A new interpolation wavelet filter has been applied in two steps, namely splitting and elevation. In the splitting step, a triangle has been divided into several sub-triangles and the elevation step has been used to ‘modify’ the point values (point coordinates for geometry) after the splitting. Then, this data set is compressed at the desired locations by using second generation wavelets. The quality of geographical surface representation after using the proposed technique is compared with the original LiDAR data. The results show that this method can be used for significant reduction of the data set. Keywords: Light Detection and Ranging (LiDAR), Delaunay triangulation, Triangulated Irregular Network (TIN), geographical information system, lifting scheme, second generation wavelets.
1
Introduction
Recently, most of the methods for image compression are based on wavelets and related techniques. Wavelet approaches for image compression tend to outperform Fourier approaches because of their ability to represent both spatially localized features and smooth regions in an image. The superior compression capability of wavelets combined with their natural multiresolution structure WIT Transactions on Information and Communication Technologies, Vol 38, © 2007 WIT Press www.witpress.com, ISSN 1743-3517 (on-line) doi:10.2495/DATA070041
36 Data Mining VIII: Data, Text and Web Mining and their Business Applications makes them a good representation for storing images. While working with dyadic wavelet decomposition digital images are represented by wavelet coefficients. These types of representation in dyadic wavelet decomposition are known as linear decomposition over a fixed orthogonal basis. The non-linearity in the approximation of images by wavelets is introduced by the thresholding of the wavelet coefficients. This type of approximation can be viewed as mildly nonlinear. Recently, several highly nonlinear methods for capturing the geometry of images were developed, such as wedgelets [1]; as well as edge-adapted nonlinear multiresolution and geometric spline approximation [2]. This paper presents a new approach for LIDAR data compression method using second generation wavelets. A random set of points has been approximated to represent a surface by Delaunay triangulation. The theory, computations, and applications of Delaunay triangulations and Voronoi diagrams have been described in detail in the literature [2–8]. The present work describes a fast algorithm based on Tsai’s Convex Hull Insertion algorithm [7, 8], for the construction of Delaunay triangulations of arbitrary collections of points on the Euclidean plane. The original algorithm has been improved further for a faster computation of geometric structures. The source code has been written in FORTRAN compiler. Once the triangulated irregular network has been created from the random set of points was further subjected to compression by using second generation wavelets. Results were shown in a comparative study basis for the TIN data compression at different level of resolution.
2
Delaunay triangulation
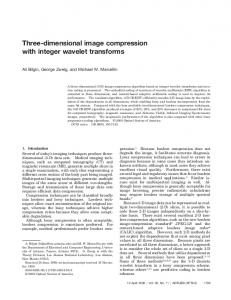
Many researchers [3, 9, 10], have suggested different ways to construct triangulations with the local equilateral property. A well known construction called the Delaunay Triangulation simultaneously optimizes several of the quality measures such as max-min angle, min-max circumcircle, and min-max min-containment circle. For more information on Delaunay triangulations see the surveys by Fortune [11]. There is a nice relationship between Delaunay triangulation and three dimensional convex hulls. Lift each point of the input to a paraboloid in three-space by mapping the point with coordinates ( x, y) to the point ( x, y, x 2 + y 2 ) . The convex hull of the lifted points can be divided into lower and upper parts: a face belongs to the lower convex hull if it is supported by a plane that separates the point set from (0, 0, − ∞) . It can be shown that the DT of the input points is the projection of the lower convex hull onto the xy plane as depicted in Figure 1. Finally a direct characterization: if a and b are input points the DT contains the edge { a , b } if and only if there is a circle through a and b that intersects no other input points and contains no input points in its interior Moreover each circumscribing circle (circumcircle) of a DT triangle contains no input points in its interior. The following are some properties of Delaunay triangulations have been discussed. WIT Transactions on Information and Communication Technologies, Vol 38, © 2007 WIT Press www.witpress.com, ISSN 1743-3517 (on-line)
Data Mining VIII: Data, Text and Web Mining and their Business Applications
•
•
•
37
Let Y denote a finite planar point set. A Delaunay triangulations D(Y) of Y is one, such that for any triangle in D(Y) , the interior of its circumcircle does not contain any point from Y . This specific property is termed as Delaunay property. The Delaunay triangulation D(Y) of Y is unique, provided that no four points in Y are co-circular. Since neither the set X of pixels nor its subsets satisfy this condition, we initially perturb the pixel positions in order to guarantee unicity of the Delaunay triangulations of X and of its subsets. Each perturbed pixel corresponds to one unique unperturbed pixel. From now on, we denote the set of perturbed pixels by X , and the set of unperturbed pixels by ˜ X .
Z
Upper convex hull
Delaunay triangulation
Figure 1: •
Lower convex hull
The lifting transformation maps the DT to the lower convex hull.
For any y ∈ Y , D(Y \ y) can be computed from D(Y) by a local update. This follows from the Delaunay property, which implies that only the cell C( y) of y in D(Y) needs to be retriangulated. Recall that the cell C( y) of y is the domain consisting of all triangles in D(Y) which contain y as a vertex. Figure 1 shows a vertex y ∈ D(Y) and the Delaunay triangulation of its cell C( y) .
•
D(Y) provides a partitioning of the convex hull [Y] of Y .
3 Interpolation wavelet filters for TIN An interpolation wavelet filter for TIN lies in subdivision process which has two steps [12]. One is a splitting step; the other one is an elevation step. In the splitting step, a triangle is divided into several sub-triangles. The elevation step is to calculate the point values (point coordinates for geometry) after the splitting. Let us discuss this partition step mathematically. WIT Transactions on Information and Communication Technologies, Vol 38, © 2007 WIT Press www.witpress.com, ISSN 1743-3517 (on-line)
38 Data Mining VIII: Data, Text and Web Mining and their Business Applications
Figure 2:
Irregular set of points. Figure 3: The TIN data structure using Delaunay triangulation.
Consider a data set to be partitioned into two groups, called s and e . Using P to express the point coordinates, one can construct an estimation of Ps based on Pe . ~ Ps = E(Pe ) (1) The estimation function (filter) E can be a local estimation or global estimation. A global estimation is generally computationally expensive; therefore, a local estimation using only neighboring points is preferred. After the estimation step, a wavelet term, W s and an approximation term, A s for the original data can be constructed as: ~ W s = Ps − Ps A e = Pe + C( Ws ) (2) The correction function C is a customizable function based on different optimization requirements. An inverse transform can be constructed as: Pe = A e − C( Ws )
(3)
P s = Ws + E (Pe ) If the original point set can be partitioned into a nested group, then the above process can be iteratively applied to different sets in this group. A nested group has the flowing structure: e0 ⊂ e1 ⊂ e 2 ⊂ ⊂ eN (4)
e i ∪ s i = e i +1 , i = 0, … , N − 1 e N denotes the finest representation of the geometry. e N can be partitioned into e N −1 and s N −1 ; then e N −1 can be partitioned into e N − 2 and s N − 2 , and so on, until e1 is partitioned into e 0 and s 0 . Note that the superscripts are used to represent different resolutions (larger numbers represent finer resolution). Based WIT Transactions on Information and Communication Technologies, Vol 38, © 2007 WIT Press www.witpress.com, ISSN 1743-3517 (on-line)
Data Mining VIII: Data, Text and Web Mining and their Business Applications
39
on this nested (or hierarchical) structure of the partition, one can construct wavelets and approximations of the data as: A e N = Pe N i
e =e
i −1
∪s
i −1
, B ei −1 = A ei (e i −1 ), B s i −1 = A ei (s i −1 )
(5)
Wei −1 = B ei −1 − E(B ei −1 ), i = N, N − 1, … ,1 A e i −1 = B ei −1 + C( Wsi −1 )
Here, B is an intermediate symbol to represent the partitioning result. A e i is partitioned into two components: A e i (e
i −1
)
and A e i (s
i −1
)
, which belong to
ei −1 and s i −1 respectively. Based on equation (5), the original data Pe N is
decomposed into A e 0 , Ws 0 , Ws1 ,….. Ws N−1 . Equation (5) is the analysis transform, which decomposes the finer representation into a coarser representation plus details. The synthesis transforms in the inverse transform and is shown in equation (6). The reconstructed A e 0 , A e1 ,….., A e N (= Pe N ) yield a multiresolution representation of the original data. Be i = A e i − C( Ws i ) Bs i = Ws i + E (Be i ), i = 0,1, … , N − 1 ei +1 = ei ∪ s i , A e i+1 (e i ) = Be i , A e i+1 (s i ) = Bs i
(6)
Pe N = A e N
In the above derivation of a wavelet representation [13–18], the process does not depend on a regular setting for the data; therefore, it can be used in both the regular and irregular setting cases. This is an important advantage of the lifting scheme [17, 18]. If the filters E and C are the same for every point at a given level, the scheme is a uniform scheme. If they also do not change with the resolution, i , the scheme is a stationary scheme as well. However, equations (5) and (6) are general formulas. Non-stationary and non-uniform schemes can be written in this form with indices on E and C . Nevertheless, those schemes could cost more computing resources and may be less effective for data compression in GIS applications.
4
Lifting scheme algorithm
The scheme described in previous section 3 is one type of filter based on the lifting scheme. This is called an approximation filter, in which every point value will change after each iteration. The other type of filter based on the lifting scheme is an interpolation filter, in which a point value reaches its final position WIT Transactions on Information and Communication Technologies, Vol 38, © 2007 WIT Press www.witpress.com, ISSN 1743-3517 (on-line)
40 Data Mining VIII: Data, Text and Web Mining and their Business Applications once it is calculated. For GIS terrain data, however, interpolation is generally preferred because point values are often more useful than a general shape. Therefore, interpolation wavelet filters will be used in this research for processing three-dimensional terrain data. First the approximation of the function was determined linearly. Then the lifting scheme was used to determine the best basis function and the coefficients. The lifting scheme has been employed to provide the boundary high and low pass filters. P3
y
A1
A2 o
P2 A3
P1
x Figure 4:
A surface showing the areas of the triangles to calculate the wavelet coefficients.
The algorithm can be described as the figure 4. The image to be encoded can be regarded as a discrete surface, i.e. a finite set of points in three-dimensional (3-D) space, by considering a non-negative discrete function of two variables F( x, y) and establishing the correspondence between the image and the surface A = {(x, y, c )| c = F( x , y)} , so that each point in A corresponds to a pixel in the image; the couple ( x, y) gives the pixel’s position in the XY plane, while c is the point’s height. Our goal is to approximate A by a discrete surface B = {(x , y, d ) | d = G ( x , y)} , defined by means of a finite set of points. Let T be a generic triangle on the XY of vertices: P1 = ( x 1 , y1 ), and let
P2 = ( x 2 , y 2 ),
P3 = ( x 3 , y 3 ),
c1 = F ( x1 , y1 ),
c 2 = F ( x 2 , y 2 ),
c3 = F ( x3 , y 3 ),
where P1 , P2 and P3 are represented as
( x 1 , y1 , c1 ),
( x 2 , y 2 , c 2 ),
( x 3 , y 3 , c 3 ) ∈ A.
WIT Transactions on Information and Communication Technologies, Vol 38, © 2007 WIT Press www.witpress.com, ISSN 1743-3517 (on-line)
(7)
Data Mining VIII: Data, Text and Web Mining and their Business Applications
41
Let O be the centroids of the triangle which means a new point after adding into the triangulation. Let A 1 , A 2 and A 3 be the area of the three triangles. Then the total area A can be represented as: A = A1 + A 2 + A 3 The detail coefficient can be represented as in equation 9.
(8)
d n = Z n − P ( Z en ) n
where, d is the detail coefficient at the n th
th
level and
(9) P ( Z en )
is the predicted
n
value at n level and Z is the values at the odd samples. The equation above can be rewritten in a general form for n − 1th level as n Z n −1 = Z even + C( d n )
(10)
n
where C(d ) A P = 1 A
A2 A
A3 A
(11)
C = PT
Thus, by changing the correction factor C in equation 11, we can select the wavelet coefficients. These wavelet coefficients will determine the number of “significant points” that can be removed from the triangulation. These significant points will be used to represent the surface.
5
Experimental results
All algorithms were coded in Visual Fortran and MATLAB and executed on a Pentium IV, 256 MB RAM machine. The optimized code is about 2000 lines of Visual Fortran and 500 lines of MATLAB. To evaluate the performance of the wavelet based triangulation compression method several test data were used. The wavelet based triangulation compression method gives consistently better performance for the LIDAR data that we used. Three different sets of LIDAR data have been used to check the efficiency of the compression program. TIN was compressed using the second generation wavelets. Based on the initial configuration of the original TIN, different resolutions are constructed during wavelet analysis. Figures 5a, 5b and 6a, 6b show the results computed using the wavelet based lifting scheme algorithm. Figure 5a shows the original data. Figure 6a shows the results after 12% compression and figure 7a shows after 23% compression. Figure 7b shows the triangulation of the image after compression. Different compression schemes, such as Huffman coding can be applied to these wavelet coefficients to further reduce the storage size. This work also provides current implementation of WIT Transactions on Information and Communication Technologies, Vol 38, © 2007 WIT Press www.witpress.com, ISSN 1743-3517 (on-line)
42 Data Mining VIII: Data, Text and Web Mining and their Business Applications wavelet coefficients during the compression operation. The proposed algorithm has the multiresolution capability and easy to compress due to large number of wavelet coefficients with small magnitudes which is suitable for distributed GIS applications such as web displaying.
(a) Figure 5:
(a) Initial Terrain (Gouraud shaded); (b) Triangulation for the initial terrain (5,000 points).
(a) Figure 6:
(b)
(a) Terrain compression at 12 % (Gouraud shaded); (b) Triangulation for the terrain at 12% (1,023 points).
(a) Figure 7:
(b)
(b)
(a) Terrain compressed at 23% (Gouraud shaded); (b) Triangulation of the terrain at 23% (870 points).
WIT Transactions on Information and Communication Technologies, Vol 38, © 2007 WIT Press www.witpress.com, ISSN 1743-3517 (on-line)
Data Mining VIII: Data, Text and Web Mining and their Business Applications
6
43
Conclusion
The construction of Triangulated Irregular Network using Delaunay triangulation for the LIDAR data has been shown. This approach uses fast and efficient second generation wavelets algorithm for multiresolution analysis of GIS data compression. This algorithm is easy to perform the mathematical and computational operation with minimal time, irrespective of the large data. Our algorithm scheme preserves high-gradient regions that might exist in a given data set. We have tested our method with various data sets. The computational cost of our algorithm depends on the different approaches used. The initial triangulation can be done in O (n log n ) , the gradient approximation can be done in O(n log n ) . The individual refinement step has to check all the original data points lying in the involved triangles, so the complexity of each step is O (n ) . How often the iteration step is executed depends on the error value given in the input. As a general rule, the authors have assumed that no more iteration should be done than they are original data sites. So the overall complexity is O (n 2 ) . We are currently investigating the detailed error analysis for the different sets of data sets at different scales.
References [1] [2]
[3] [4] [5] [6] [7] [8]
Donoho, D., Wedgelets: Nearly-Minimax Estimation of Edges. Annals of Statistics, vol. 27, pp. 859–897, 1999. Demaret, L., Dyn, N., Floater, M. S. & Iske, A., Adaptive Thinning For Terrain Modelling and Image Compression in Advances in Multiresolution for Geometric Modelling, N. A. Dodgson, M. S. Floater, and M. A. Sabin (eds.), Springer-Verlag, Heidelberg, pp. 321–340, 2004. Lawson, C. L., Generation of a Triangular Grid with Application to Contour Plotting. California Institute of Technology, Jet Pollution Laboratory, Technical Memorandum No. 299, 1972. Sibson, R., Locally Equiangular Triangulations. Computer Journal, vol. 21, no. 3, pp. 243-245, 1978. Kao, T., Mount, D. M. & Saalfeld, A., Dynamic Maintenance of Delaunay Triangulations. Proceedings of Auto-Carto I0, Baltimore, Maryland, pp. 219-233, 1991. Puppo, E., Davis, L., DeMenthon, D. & Teng, Y. A., Parallel Terrain Triangulation. Proceedings of. 5th International Symposium on Spatial Data Handling, vol. 2, Charleston, South Carolina, pp. 632—641, 1992. Tsai, V. J. D. & Vonderohe, A. P., A Generalized Algorithm for The Construction of Delaunay Triangulations in Euclidean N-Space. Proceedings GIS/LIS '91, vol. 2, Atlanta, Georgia, pp. 562-571, 1991. Tsai, V. J. D., Fast Topological Construction of Delaunay Triangulations and Voronoi Diagrams. Computer & Geosciences, vol. 19, no. 10, pp. 1463- 1474, 1993. WIT Transactions on Information and Communication Technologies, Vol 38, © 2007 WIT Press www.witpress.com, ISSN 1743-3517 (on-line)
44 Data Mining VIII: Data, Text and Web Mining and their Business Applications [9] [10] [11] [12]
[13] [14] [15]
[16] [17] [18]
Evans, W., Kirkpatrick, D. & Townsend, G., Right-Triangulated Irregular Networks. Algorithmica: Special Issue on Algorithms for Geographical Information Systems, vol. 30, no. 2, pp. 264-286, 2001. Abásolo, M. J., Blat, J. & De Giusti, A., A Hierarchical Triangulation for Multiresolution Terrain Models. The Journal of Computer Science & Technology (JCS&T), vol. 1, no. 3, 2000. Fortune, S., Voronoi Diagrams and Delaunay Triangulations: in Computing in Euclidean Geometry, ed. F. K. Hwang and D. Z. Du, World Scientific, 1992. Kiema, J.B.K., & Bähr, H.-P., Wavelet Compression and The Automatic Classification of Urban Environments Using High Resolution Multispectral Imagery and Laser Scanning Data. Geoinformatics, vol. 5, pp. 165-179, 2001. Wu, J. & Amaratunga, K., Wavelet Triangulated Irregular Networks. International Journal of Geographical Science, vol. 17, no. 3, pp. 273289, 2003. Dyn, N., Levin, D. & Gregory, J. A., A Butterfly Subdivision Scheme for Surface Interpolation with Tension Control. ACM Transaction on Graphics, vol. 9, pp. 160- 169, 1990. Cohen, A., Applied And Computational Aspects Of Nonlinear Wavelet Approximation. Multivariate Approximation and Applications, N. Dyn, D. Leviatan, D. Levin, & A. Pinkus (eds.), Cambridge University Press, Cambridge, pp. 188–212, 2001. Mallat, S., A Theory Of Multiresolution Signal Decomposition: The Wavelet Representation. IEEE Transaction on Pattern Analysis and Machine Intelligence, vol. 11, pp. 674-693, 1989. Sweldens, W., Construction and Applications of Wavelets in Numerical Analysis. Unpublished PhD thesis, Dept. of Computer Science, Katholieke Universiteit Leuven, Belgium, 1994. Sweldens, W., The Lifting Scheme: A Custom-Design Construction of Biorthogonal Wavelets. Applied Computer Harmonic Analysis, vol. 3, no. 2, pp. 186- 200, 1996.
WIT Transactions on Information and Communication Technologies, Vol 38, © 2007 WIT Press www.witpress.com, ISSN 1743-3517 (on-line)