Received 1 October 1999; accepted 19 January 2000. The statistical properties of plasma fluctuations have been investigated in the plasma boundary region of ...
PHYSICS OF PLASMAS
VOLUME 7, NUMBER 5
MAY 2000
Statistical characterization of fluctuation wave forms in the boundary region of fusion and nonfusion plasmas E. Sa´nchez, C. Hidalgo, D. Lo´pez-Bruna, I. Garcı´a-Corte´s, R. Balbı´n, M. A. Pedrosa, and B. van Milligen Asociacio´n Euratom-Ciemat, 28040 Madrid, Spain
C. Riccardi and G. Chiodini Universita’ degli Studi di Milano-Bicocca and INFM, 20126 Milano, Italy
J. Bleuel and M. Endler IPP Garching, EURATOM Association, 85740 Garching, Germany
B. A. Carreras Oak Ridge National Laboratory, Oak Ridge, Tennessee 37831-8070
D. E. Newman University of Alaska–Fairbanks, Fairbanks, Alaska 99775-5920
共Received 1 October 1999; accepted 19 January 2000兲 The statistical properties of plasma fluctuations have been investigated in the plasma boundary region of fusion 共tokamaks and stellarators兲 and nonfusion plasmas. Fluctuations in ion saturation current and floating potential have a near-Gaussian character in the proximity of the velocity shear layer (r sh). However, fluctuations deviate from a Gaussian distribution when moving inside of the plasma edge (r⬍r sh) or into the scrape-off layer region (r⬎r sh). Furthermore, fluctuations show sporadic pulses that are asymmetric in time. The present analysis shows a coupling of those pulses and the averaged flow in the shear layer region. © 2000 American Institute of Physics. 关S1070-664X共00兲00805-3兴
I. INTRODUCTION
emphasize the importance of comparative studies between fusion and nonfusion devices to clarify the role of critical gradients on plasma turbulence.12 From previous analysis, we have seen that fluctuations are coupled to the edge shear flow. This coupling has been found by measuring the Reynolds stress tensor in the plasma edge region in different devices.13–15 Here we look at the coupling from another perspective, how the edge shear flow modifies or generates fluctuation pulses. To do so, we focus on the characterization of the pulse wave form and how it changes as we look around the shear layer position. A systematic investigation of the statistical properties of fluctuations in the plasma boundary region of stellarators, Advanced Toroidal Facility 共ATF兲16 and Wendelstein 7-Advanced Stellarator 共W7-AS兲,17 and tokamak, Joint European Torus 共JET兲,18 is presented. We also compare these results to those obtained by analyzing the plasma fluctuations in a nonfusion device 共Thorello兲.19 The paper is organized as follows. The statistical tools used in the analysis of experimental signals are presented in Sec. II. The experimental investigation of the statistical properties of fluctuations in fusion and nonfusion plasmas is described in Sec. III. A discussion of the experimental results is presented in Sec. IV. In Sec. V results from a numerical simulation of competition between instability drive and decorrelation effects are presented. Conclusions are given in Sec. VI.
In order to improve our understanding of the nature of anomalous transport in magnetically confined fusion plasmas, comparative studies of the structure of plasma turbulence in different fusion devices have been carried out in the last several years.1 The comparison of the structure of fluctuations supports the view that plasma turbulence displays universality.2 The statistical properties of both the time-resolved particle flux and fluctuations have been investigated in the plasma boundary region of tokamak and stellarator devices. It has been observed that the distribution function of the local particle flux has significant non-Gaussian features3–6 and there is a striking similarity between the statistical properties of the turbulent flux in different devices.3,5 In particular, a significant fraction of the total flux can be attributed to the presence of large and sporadic bursts.3–5 These bursts are less apparent but are also present in the fluctuation measurements. Bursts in fluctuations might be an indication of transport close to instability thresholds;7,8 however, other mechanisms could also explain the appearance of bursty turbulence. In particular, transient coherent vortical structures have been reported to have influence on the turbulent flux, giving rise to bursts in the particle flux.9 The competition between driving and suppression mechanisms of plasma turbulence can also give rise to bursting fluctuations.10,11 Recent results 1070-664X/2000/7(5)/1408/9/$17.00
1408
© 2000 American Institute of Physics
Downloaded 10 Oct 2000 to 130.206.11.122.Redistribution subject to AIP copyright, see http://ojps.aip.org/pop/popcpyrts.html.
Phys. Plasmas, Vol. 7, No. 5, May 2000
Statistical characterization of fluctuation wave forms . . .
II. ANALYSIS TOOLS FOR THE STATISTICAL CHARACTERIZATION OF WAVE FORMS
In the past, we have studied the statistical properties of the turbulent particle flux as measured by Langmuir probes. Those studies have shown that the probability density function 共PDF兲 of the particle fluxes is clearly non-Gaussian. However, we have also identified departures from Gaussianity in the fluctuation measurements.3,5 This was particularly evident in the ion saturation current fluctuations around the edge shear flow layer. This departure from Gaussianity is associated with the appearance of pulses that have an asymmetric wave form.3 A characterization of the statistical properties of the PDF was done through the determination of the skewness and the kurtosis. In order to characterize the fluctuation pulses’ wave forms, we focus here on the skewness and the asymmetry. Given N samples 关 x(i),i⫽1,...,N 兴 of a time series x(t), the skewness, third-order moment of the probability density function, may be estimated as N
S⫽ where
1 关 x 共 i 兲 ⫺ 共 x 兲兴 3 , 共 x 兲 N i⫽1
兺
3
冉
N
1 共 x 兲⫽ 关 x 共 i 兲 ⫺ 共 x 兲兴 2 N i⫽1
兺
冊
共1兲
1/2
,
N
1 共 x 兲⫽ x共 i 兲 N i⫽1
兺
are the standard deviation and the mean value estimates, respectively. The skewness 共S兲 gives a measure of the degree of symmetry of the PDF with respect to its mean value. For a symmetric distribution, S equals zero. A positive value of the S parameter corresponds to an asymmetric PDF with a longer tail for x(t)⬎ (x) than for x(t)⬍ (x). We have the opposite situation for S⬍0. In order to quantify the degree of time asymmetry of turbulent events, we can estimate the skewness of the time derivative of the signal 共A兲 as 1 A⫽ 3 共 xt兲N
N⫺1
兺
i⫽1
关 x t 共 i 兲 ⫺ 共 x t 兲兴 3 ,
共2兲
where x t ⫽dx/dt is the time derivative of the signal, x t (i) ⫽ 关 x(i⫹1)⫺x(i) 兴 /⌬t,⌬t being the sampling period. This parameter measures the degree of time asymmetry in the fluctuating signal. A value of A⫽0 corresponds to a signal whose time derivative has a symmetric PDF. Positive values of A indicate that the signal has, on average, fluctuations with a rise time shorter than its decay time. When A ⬍0, the signal shows decay times shorter than the corresponding rise times. For instance, let us consider a periodic signal made up from equal size sawtooth wave forms. For this wave form, t 1 is the rising time and t 2 the decay time. An analytical estimate of the skewness gives S⫽0 and the asymmetry A⫽(t 2 ⫺t 1 )/ 冑t 1 t 2 . This clearly shows that the parameter A measures the asymmetry of the wave form. We have used this parameter to quantify the time asymmetry of fluctuation turbulent bursts.
1409
The estimation of high order moments of a PDF from a limited number of samples requires an estimation of the statistical errors associated with the calculation. The method used in this work to quantify statistical errors in moment estimates is described in the Appendix. III. STATISTICAL PROPERTIES OF FLUCTUATIONS IN DIFFERENT CONFINEMENT DEVICES
Plasma edge turbulence has been characterized by measuring the fluctuations in the ion saturation current and floating potential signals, using Langmuir probes.20 The experiments that we consider in this work have been carried out in the plasma boundary region of tokamak 共JET兲,18 stellarators 共ATF16 and W7-AS兲,17 and low temperature plasmas 共Thorello兲.19 In what follows, we summarize the main results of the analysis for these experiments. A. Experiments in the ATF torsatron
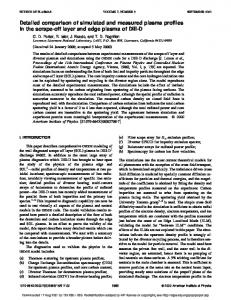
The ATF stellarator is a four field period (M ⫽4, 1 ⫽2) torsatron with a major radius R⫽2.1 m and averaged minor radius a⫽0.27 m. The fluctuation measurement experiments were performed in electron cyclotron resonant heated 共ECRH兲 plasmas, with heating power P ECRH ⬇200 kW and magnetic field B⫽1 T. Fluctuations have been characterized using the experimental setup previously described.21 Measurements were done in the proximity of the naturally occurring velocity shear layer.22 Signals were digitized at a sampling rate of 1 MHz, using a 10 bit. 16 kbytes/ channel digitizer. In a series of similar reproducible plasma discharges, measurements were taken at different radial positions. The probe was fixed at a radial position during the discharge and its position was changed from shot to shot. Figure 1共a兲 shows the plasma edge electron density profile, as deduced from ion saturation current measurements. The poloidal phase velocity of fluctuations (V ) is shown in Fig. 1共b兲. This velocity is deduced from the measurements of two floating probes poloidally separated by 2 mm. Around the position Z⫽39 cm, the phase velocity of fluctuations changes sign from propagation in the ion drift direction in the scrape-off layer 共SOL兲 to propagation in the electron drift direction at the plasma edge 共velocity shear location兲. Each point shown in Figs. 1 and 2 has been calculated using 1.6 ⫻104 samples. The skewness of the ion saturation current, floating potential, and their corresponding time derivatives 共asymmetry兲 has been computed using the definitions given in Eqs. 共1兲 and 共2兲. The skewness 关Eq. 共1兲兴 of the ion saturation current and floating potential signals are shown in Figs. 2共a兲 and 2共c兲. It can be seen that the PDF of both saturation current and floating potential deviates from a Gaussian distribution (S⬎0) in the SOL region of the plasma. In Figs. 2共b兲 and 2共d兲 we show the degree of time asymmetry in turbulent bursts 关a parameter given by Eq. 共2兲兴 for ion saturation current and floating potential signals. Ion saturation current has a positive asymmetry in the scrape-off layer side of the velocity shear location, corresponding to fluctuation pulses with a rise time shorter than their decay time (A⬎0). In the SOL region, the floating potential sig-
Downloaded 10 Oct 2000 to 130.206.11.122.Redistribution subject to AIP copyright, see http://ojps.aip.org/pop/popcpyrts.html.
1410
Phys. Plasmas, Vol. 7, No. 5, May 2000
FIG. 1. Plasma profiles of the electron density (n e ) and the phase velocity of fluctuations (V ) deduced from Langmuir probes measurements in the plasma boundary region of the ATF stellarator.
nals have A⬍0, corresponding to fluctuation pulses with fast decay and slow rise. The degree of time asymmetry of both signals changes around the shear layer, with A⬇0 at this position. Similar results have been obtained in analyzing different measurements obtained in similar experiments. B. Experiments in JET tokamak
In the JET tokamak (R⫽2.85 m, a⫽0.95 m), measurements were taken by a multiple Langmuir probe,23 in the limiter phase of ohmic heated discharges (B⫽2.4 T, I p ⬇2 MA兲.
Sa´nchez et al.
In these measurements, a fast reciprocating Langmuir probe was inserted into the plasma boundary region making it possible to measure edge profiles of saturation current and floating potential in a single shot. Signals were sampled at a rate of 0.5 MHz. Radial profiles of the ion saturation current and the poloidal phase velocity of fluctuations (V ) are shown in Fig. 3, in which (r sep) corresponds to the location of the last closed flux surface computed by magnetic codes. Figure 4 shows the results obtained for the skewness 共S parameter兲 and the degree of time asymmetry 共A parameter兲 for both ion saturation current and floating potential signals. The saturation current has a nonsymmetric PDF (S⬎0) in the SOL, and the S parameter increases as the probe moves outward. The floating potential signal also has a nonsymmetric PDF in the region ⫺2 cm⬍r⫺r sep⬍3 cm. Both signals, current and potential, have rather symmetric PDFs (S⫽0) around the position of the shear layer (r⫺r sep⬇⫺2 cm). The asymmetry 共A兲 of the saturation current has positive values in the SOL region of the plasma (⫺2 cm⬍r⫺r sep ⬍3 cm), implying fluctuation pulses with a rise time shorter than its decay time. The floating potential signal has negative values of the A parameter in the same region. The values of the A parameter, for both saturation current and floating potential, are close to zero in the proximity of the velocity shear location (r⫺r sep⫽⫺2 cm). As the probe moves radially, the signal is not strictly stationary but both the mean and the rms values are changing in time. This nonstationarity can lead to misestimating the moments.24 In the present experiments we have used 2500 samples 共5 ms兲 to compute the S and A parameters. In this time interval the signal can be considered quasistationary. The analysis was repeated with different sample 共time window兲 sizes and the results were very similar, thus proving the validity of the quasistationarity assumption. The radial dependence of S and A have been studied in several similar plasma discharges and very similar results were obtained.
FIG. 2. Skewness 共S兲 and asymmetry 共A兲 of saturation current 关共a兲, 共b兲兴 and floating potential 关共c兲, 共d兲兴 in the plasma boundary region of ATF. The gray band shows the zone where the radial gradient in the phase velocity is largest.
Downloaded 10 Oct 2000 to 130.206.11.122.Redistribution subject to AIP copyright, see http://ojps.aip.org/pop/popcpyrts.html.
Phys. Plasmas, Vol. 7, No. 5, May 2000
FIG. 3. Plasma profiles of the ion saturation current (I s ) and the phase velocity of fluctuations (V ) measured by Langmuir probes in the plasma boundary region in the JET tokamak.
C. Experiments in W7-AS stellarator
In the stellarator W7-AS (M ⫽5, 1⫽2, R⫽2 m, a ⫽0.2 m兲, experiments were performed under electron cyclotron resonant heating 共ECRH兲, with heating power P ECRH ⬇200 kW and magnetic field B⫽1.25 T. As in the case of JET experiments, a fast reciprocating Langmuir probe was inserted into the plasma boundary region making it possible to measure edge profiles in a single shot. Measurements were digitized at a sampling rate of 2 MHz. In the present experi-
Statistical characterization of fluctuation wave forms . . .
1411
ment we have used 8000 samples 共4 ms兲 to compute the S and A parameters. In this time interval the signal can be considered quasistationary. The results are quite similar when the analysis is repeated with different sample sizes below 8000 samples. Figure 5 shows the ion saturation current and the poloidal phase velocity of fluctuations (V ) deduced from two measurements of floating potential signals poloidally separated by 2 mm. In Fig. 5 (r sh) corresponds to the position of the velocity shear, where the phase velocity of fluctuations changes sign and has a larger gradient. The radial profiles of S and A parameters at the plasma boundary of the W7-AS stellarator are shown in Fig. 6. The ion saturation current is a nonsymmetric signal at all the radial positions studied, having positive fluctuation pulses (S⬎0). The radial variation of the skewness of the saturation current and floating potential signals show certain radial structure, the deviation from a Gaussian distribution being maximum around r⫺r sh⬇0.2 cm and r⫺r sh⬇2.5 cm 关see Figs. 6共a兲 and 6共c兲兴. Near r⫺r sh⬇1 cm, where the velocity curvature peaks, the deviation of saturation current and floating potential PDFs from a Gaussian distribution has a local minimum. With respect to the degree of time asymmetry, Fig. 6共b兲 shows that saturation current has fluctuation pulses with short rise time and a longer decay time, as it corresponds to A⬎0. The radial structure observed in the skewness is reproduced in the asymmetry 共A兲. The time asymmetry of the fluctuation pulses in the saturation current decreases at the outer region of the SOL(r⫺r sh⬎3 cm). Figure 6共d兲 shows that the floating potential has fluctuation pulses with fast decay and slow rise (A⬍0) at the SOL region (r⫺r sh ⬎0). D. Experiments in Thorello low temperature plasmas
The statistical properties of fluctuations have been studied in the Thorello device (R⫽0.4 m, r⫽0.08 m, B ⬇0.25 T兲 using Langmuir probes. Typical edge plasma pa-
FIG. 4. Skewness 共S兲 and asymmetry 共A兲 of saturation current 关共a兲, 共b兲兴 and floating potential 关共c兲, 共d兲兴 in the plasma boundary region of JET. The gray band shows the zone where the radial gradient in the phase velocity is largest.
Downloaded 10 Oct 2000 to 130.206.11.122.Redistribution subject to AIP copyright, see http://ojps.aip.org/pop/popcpyrts.html.
1412
Phys. Plasmas, Vol. 7, No. 5, May 2000
FIG. 5. Plasma profiles of the ion saturation current (I s ) and the phase velocity of fluctuations (V ) measured by Langmuir probes in the plasma boundary region in the W7-AS stellarator.
rameters in this device are: plasma density ⬇1011 cm⫺3 and electron temperatures in the range of 1–5 eV. Previous measurements of plasma fluctuations in the Thorello device have shown fluctuations levels in density and potential up to 40%.25 Metallic plates are inserted in the plasma to control the plasma size, thus acting as limiters; a velocity shear layer is formed in the proximity of the metallic plate location. Measurements were done at different radial positions along the minor radius of Thorello plasma, radially moving the
Sa´nchez et al.
probe during the steady-state discharge. The signals were digitized at a sampling rate of 1 MHz using a 32 kbytes/ channel digitizer. As in fusion plasmas, the floating potential and the radial electric field change sign in the proximity of the limiter radius. As a consequence, the poloidal velocity reverses from propagation in the ion drift direction at the outer region to propagation in the electron drift direction in the plasma bulk side of the shear location. Figure 7 shows the floating potential and the E⫻B velocity (V E⫻B ) deduced from plasma potential measurements, plotted versus the radial position 共r兲. The radial gradient in V E⫻B is about 105 s⫺1 in the shear location. The radial profiles of the skewness of the ion saturation current and floating potential 共S parameter兲 and its time derivatives 共A parameter兲 are shown in Fig. 8. For ion saturation current, the S parameter is very close to zero in the proximity of the shear location and increases both in the outer region of the plasma (r⬎5 cm) and in the plasma inner region (r⬍4 cm). At r⬇4.5 cm saturation current fluctuations have a near-Gaussian character with a symmetric PDF. In the case of floating potential, fluctuations have a nearsymmetric PDF at r⬇5 cm, and an asymmetric PDF (S ⬍0) both in the outer region (r⬎5 cm) and inside the shear layer (r⬍4 cm). The A parameter is positive for the ion saturation current signal at both sides of r⬇4.5 cm. In the case of floating potential, fluctuation pulses have a negative asymmetry at both sides of r⬇5 cm. IV. DISCUSSION OF THE EXPERIMENTAL RESULTS
Two different features have been observed in the fluctuations. On the one hand, it has been shown that fluctuations have a non-Gaussian character, mainly in the scrape-off layer region of the plasma. For positive defined signals 共e.g., plasma density兲 a nonGaussian PDF is expected when the standard deviation is
FIG. 6. Skewness 共S兲 and asymmetry 共A兲 of saturation current 关共a兲, 共b兲兴 and floating potential 关共c兲, 共d兲兴 in the plasma boundary region of W7-AS. The gray band shows the zone where the radial gradient in the phase velocity is largest.
Downloaded 10 Oct 2000 to 130.206.11.122.Redistribution subject to AIP copyright, see http://ojps.aip.org/pop/popcpyrts.html.
Phys. Plasmas, Vol. 7, No. 5, May 2000
FIG. 7. Plasma profiles of the ion saturation current (I s ) and E⫻B velocity deduced from plasma potential measurements (V E⫻B ) along the minor radius of Thorello plasma.
similar to the mean value, as is the case in the SOL region where the normalized fluctuation levels are high 共⬇30– 40%兲. In particular, the ion saturation current is a positive defined function for which a Poisson-like distribution is more likely than a Gaussian one at this region. In the case of the potential signal, the signal provided by the Langmuir probes is f ⫽ p ⫺ ␣ T e , where p is the plasma potential, T e is the electron temperature, and ␣ ⬇3 for hydrogen plasmas. As T e is positive defined, it would be expected to have a Poisson-like distribution, thus influencing the statistical properties of f . Taking into account these considerations, a
Statistical characterization of fluctuation wave forms . . .
1413
monotonous change of the non-Gaussian character as the normalized fluctuation level increases 共moving outward兲 would be expected.26 However, singular changes in the values of the S parameter of both saturation current and floating potential around the position of zero velocity 共ATF, W7-AS兲 or a minimum in the S parameter around this position 共JET, Thorello兲 have been observed, which suggests that this is not the key mechanism to explain the lack of Gaussianity observed in edge fluctuations. A deviation in the PDF of fluctuations from a Gaussian distribution can be expected in the presence of coherent structures. This kind of deviation has been observed in numerical simulations of plasma turbulence.9,27 A second feature observed in fluctuations is the time asymmetry of turbulent bursts. This property is not dependent on the lack of Gaussianity in the signals, but it carries dynamical information. Different mechanisms should be considered to explain this feature of plasma turbulence in the plasma boundary region in fusion and nonfusion plasmas. First, the time asymmetry could be a consequence of the propagation, either radial or poloidal, of spatially asymmetric turbulent structures. This picture is consistent with the fact that, in some cases 共ATF, JET, Thorello兲, there is an actual poloidal propagation with A being minimum in the proximity of the zero poloidal velocity point. The fact that the time asymmetry of fluctuation spikes changes around the velocity shear layer suggests that some mechanisms related to the shear layer is involved in the modification of the fluctuation properties in the plasma boundary region. The interplay between the shear flow and the fluctuations has been observed by studying the electrostatic Reynolds stress in the plasma boundary region in different devices.13–15 The time asymmetry of the bursts suggests the presence of competition processes, typical from Volterra systems, already observed in several simulations of edge turbulence.28 The shear layer could have an influence on radially propagating structures generated inside this region. Self-
FIG. 8. Skewness 共S兲 and asymmetry 共A兲 of saturation current 关共a兲, 共b兲兴 and floating potential 关共c兲, 共d兲兴 measured by Langmuir probes along the minor radius of Thorello plasma.
Downloaded 10 Oct 2000 to 130.206.11.122.Redistribution subject to AIP copyright, see http://ojps.aip.org/pop/popcpyrts.html.
1414
Sa´nchez et al.
Phys. Plasmas, Vol. 7, No. 5, May 2000
organized criticality models have recently been proposed to explain the nature of transport in fusion devices.7,8 Within this paradigm, the presence of radially propagating transport avalanches would lead to non-Gaussian features in fluctuations in the plasma boundary region, and, perhaps, to time asymmetry of fluctuations events. The shear layer would decorrelate avalanches, leading to fluctuations with a nearGaussian character and reducing the time asymmetry of fluctuation events. The shear layer could play a more active role in generating fluctuation pulses with time symmetry. In the present experiments the radial gradient in the poloidal phase velocity of fluctuations is about d v phase /dr⬇105 s⫺1 , which can be interpreted in terms of an E⫻B shearing rate. The correlation time of fluctuations at the shear location ( v phase⬇0) is in the range c ⬇10⫺6 ⫺10⫺5 s. This means that the E⫻B shearing rate at the velocity shear layer is comparable to 1/, suggesting that the competition between driving mechanisms of fluctuations and E⫻B decorrelation effects could be responsible for the observed structure of the turbulence in the proximity of the velocity shear location. Finally, the characteristics of fluctuations could also be affected by the change in magnetic topology in the outer region of the plasma. Close to the shear layer location in fusion plasmas, the magnetic topology changes significantly from open field lines in the SOL to closed field lines at the plasma edge. This change in magnetic topology could have some influence on the structure of the turbulence. However, the similarity between the results observed in devices with very different magnetic topology in the outer region of the plasma 共tokamaks, stellarator, and Thorello device兲 suggests that the transition from closed to open field lines is not the key element to interpret the changes seen in the structure of the turbulence.
V. COMPETITION BETWEEN INSTABILITY DRIVE AND E Ã B SHEAR DECORRELATION: A NUMERICAL SIMULATION
To check how the competition between fluctuation driving mechanisms and E⫻B decorrelation may affect the structure of the turbulence, we have studied a numerical simulation using a model of transition to enhanced confinement regimes that is based on this mechanism. The details of the model are described in Ref. 10. The model describes the time evolution of the envelope density fluctuation level 共⑀兲, which is involved in the definition of anomalous transport. The dynamics of ⑀ comes from the competition between turbulence driving and suppression mechanism, characterized, respectively, by a linear growth rate, ␥ 共a function of the pressure gradient兲, and the E⫻B shearing rate, E⫻B 共dependent on the E⫻B velocity flow shear兲.29 Since the E⫻B shear involves the radial derivative of the radial electric field, which in turn is proportional to the pressure gradient, the shearing rate has a dependency both on the first and on the second radial derivatives of the pressure profile. The interaction between the gradient and the curvature 共the second radial derivative兲 of the pressure profile in
FIG. 9. Time evolution of the fluctuation level 共⑀兲 obtained in a simulation of core plasmas using the model of Ref. 10, under pretransition conditions, for r/a⫽0.225 共a兲 and for r/a⫽0.37 共b兲. The parameter a is the plasma radius.
the evolution of the fluctuation level is the cause of propagating bursts.11 The numerical simulations show that when the shearing rate ( E⫻B ) is close to the growth rate of the fluctuation 共␥兲, a transport barrier is formed. Fluctuations have a bursty behavior when the plasma is close to the critical condition for the transition ( E⫻B ⬇ ␥ ), but still in the low confinement mode, E⫻B ⬍ ␥ . Particularly, a threshold for the onset of this behavior is found at E⫻B / ␥ ⬇0.3.11 In these simulations, the fluctuation bursts correspond to radially propagating fluctuation pulses. The local time traces of fluctuations show a radius-dependent time asymmetry. In the present simulation, the local maximum of the ratio E⫻B / ␥ develops near r/a⬇0.25, a being the plasma radius. Figure 9 shows the time evolution of the local fluctuation level, ⑀, at r/a⫽0.225 共a兲 and r/a⫽0.37 共b兲 in the bursty phase, that is, without the presence of transport barrier. The PDFs of the time traces are asymmetric with respect to its mean value. Note that the pulses have a clear time asymmetry at r/a⫽0.37 共outside the position of maximum shearing rate兲, while they are more symmetric for r/a⫽0.225. A quantitative description of these results is given in Fig. 10, which shows the radial dependence of the time asymmetry as defined in Eq. 共2兲. In Fig. 10 it can be seen that the A parameter is minimum at r/a⫽0.225, increasing as one moves away from the radial position of maximum E⫻B / ␥ ratio. VI. CONCLUSIONS
A clear deviation from Gaussianity has been observed in the fluctuations 共ion saturation current and floating potential兲 in the scrape-off layer region of fusion and nonfusion plasmas. In particular, the PDF of the ion saturation current is asymmetric, with a long tail for values larger than the mean value in the outer region of the plasma (S⬎0). The floating potential measured by the probes shows a more slight devia-
Downloaded 10 Oct 2000 to 130.206.11.122.Redistribution subject to AIP copyright, see http://ojps.aip.org/pop/popcpyrts.html.
Phys. Plasmas, Vol. 7, No. 5, May 2000
Statistical characterization of fluctuation wave forms . . .
FIG. 10. Radial dependence of the asymmetry 共A兲 of the fluctuation level 共⑀兲 obtained in a simulation of core plasmas using the model of Ref. 10, under pretransition conditions.
tion from Gaussianity. The statistical properties of fluctuations show a radial dependence, showing a near-Gaussian character in the proximity of the velocity shear layer location, where the poloidal velocity is close to zero, and in some cases where the poloidal velocity curvature peaks. Fluctuation signals show a bursty character, with spikes nonsymmetric in time as shown by the asymmetry of the PDF for the time derivative of the signal. This time asymmetry of fluctuation events is minimum close to the shear layer. Similar characteristics have been observed both in fusion 共tokamaks and stellarator兲 and low temperature plasmas. Competition between fluctuation driving and decorrelation mechanisms at the velocity shear location is a candidate to explain the time asymmetry of fluctuation pulses. This hypothesis is consistent with the results obtained in a numerical simulation using a model based on this competition.
where M n is the nth order moment, ¯x i is the interval class mark, ⌬x is the interval width; ¯P (x) is the average value of the PDF in the interval centered at x, which we estimate as ¯P (x)⫽N x /N⌬x, N x being the number of samples with a value within the range 共x⫺⌬x/2, x⫹⌬x/2兲; is the mean N x(i), and n⬎1. value estimate ⫽(1/N) 兺 i⫽1 There are two error sources in the estimation of the moments of the distribution using Eq. 共A1兲. First, there is an error coming from the estimation of the PDF at each interval, ⑀ ( ¯P (x)); a second error comes from the assignation of a value ¯x i 共class mark兲 to all the samples within the ith inter¯ ni ). These two errors contribute to the total error in val, ⑀ (x the moment estimate. The error in the PDF estimation is a consequence of the count of samples at each interval, N x . This count of samples can be considered similar to a Poisson process, so ⑀ ( ¯P (x)) can be estimated as 冑N x /N. In order to ensure that the relative count error, 冑N x /N x , is small enough for all the intervals, the amplitude range can be divided in intervals such that the number of counts at any interval is larger than a minimum value 共typically 10兲. Thus, different intervals can have different widths; the wider intervals will be those for which the PDF has smaller values. If we use the interval class mark: ¯x i ⫽
冑
n
APPENDIX: ERRORS IN PDF MOMENTS ESTIMATES
When computing high order moments of a PDF from a limited number of samples the statistical errors associated with the estimation are critical. High amplitude samples, even infrequent in the signal, have an important contribution to the moment because they contribute with a power of its amplitude. In what follows a method to estimate the statistical error associated with the moment estimation is presented. From N samples of a random variable x 关 x(i), i ⫽1,...,N 兴 we can estimate the moments of the probability density function 共PDF兲 by dividing the amplitude range in a number of intervals 共K兲 and computing K
M ⫽ n
兺 ¯P 共 x 兲共¯x i ⫺ 兲 n ⌬x,
i⫽1
共A1兲
兺 共 x j⫺ 兲n⫹ , j⫽1
共A2兲
where x j are samples in the ith interval, we recover the standard moment estimation: K
M n⫽ ⫽
This research was sponsored in part by DGICYT 共Direccio´n General de Investigaciones Cientı´ficas y Te´cnicas兲 of Spain under Project No. PE 96-0112-C02-02 and in part by the Department of Trade and Industry and EURATOM. The authors would like to thank A. Chankin, G. F. Matthews, H. Thomsen, and K. Erents for their contribution to this paper.
N xi
1 N xi
兺
i⫽1 K
ACKNOWLEDGMENTS
1415
N xi N 1 N
冉冑
N xi
n
兺 j⫽1 兺
i⫽1
N
1 xi 共 x ⫺ 兲n N xi j⫽1 j
兺
冊
n
N
1 共 x j⫺ 兲 ⫽ 共 x ⫺ 兲n. N i⫽1 i n
兺
共A3兲
¯ ni ) as We can get an upper bound to the error ⑀ (x n ⑀ 共¯x ni 兲 ⫽Max共 兩 x nM i ⫺x ¯ ni 兩 , 兩¯x ni ⫺x mi 兩 兲,
共A4兲
x M i and x mi being the upper and lower limits of the ith interval, respectively. Finally, the sum of partial errors coming from all the intervals is expected to be reduced by a factor of 冑K,K being the number of intervals, due to cancellations of errors of different signs. The total error for an order n moment estimate (n⬎1) is
⑀共 M 兲⫽ n
1 N 冑K
冋兺 K
i⫽1
冑N xi 兩 共¯x i ⫺ 兲
K
n
兩⫹
兺 N xi ⑀ 共¯x ni 兲
i⫽1
册
,
共A5兲
⑀ (x ¯ ni )
is obtained from Eq. 共A4兲. where To check the validity of this procedure we have used several computer generated pseudorandom series. Tests have been done with Gaussian distributions, some combinations of several Gaussians giving asymmetric PDFs, and distributions with an algebraic decay P(x)⫽1/x ␣ , with 1⬍ ␣ ⬍4. The estimated moment was within the error bar estimated by this procedure in about 60% of the cases.
Downloaded 10 Oct 2000 to 130.206.11.122.Redistribution subject to AIP copyright, see http://ojps.aip.org/pop/popcpyrts.html.
1416
C. Hidalgo, Plasma Phys. Controlled Fusion 37, A53 共1995兲. M. A. Pedrosa, B. A. Carreras, C. Hidalgo, R. Balbı´n, I. Garcı´a-Corte´s, D. Newman, B. van Milligen, E. Sa´nchez, J. Bleuel, M. Endler, S. J. Davies, and G. F. Matthews, Phys. Rev. Lett. 82, 3621 共1999兲. 3 E. Sa´nchez, C. Hidalgo, M. A. Pedrosa, R. Balbı´n, I. Garcı´a-Corte´s, T. Estrada, and B. van Milligen, Transport Chaos and Plasma Physics 共World Scientific, Singapore, 1996兲, Vol. 2, p. 264. 4 M. Endler, H. Niedermeyer, L. Giannone, E. Holzhauer, A. Rudyj, G. Theimer, N. Tsois, and the ASDEX Team, Nucl. Fusion 35, 1307 共1995兲. 5 B. A. Carreras, C. Hidalgo, E. Sa´nchez, M. A. Pedrosa, R. Balbı´n, I. Garcı´a-Corte´s, B. van Milligen, D. Newman, and V. E. Lynch, Phys. Plasmas 3, 2664 共1996兲. 6 J. Petrzilka and J. Sto¨ckel, Contrib. Plasma Phys. 38S, 74 共1998兲. 7 B. A. Carreras, D. Newman, V. E. Lynch, and P. H. Diamond, Phys. Plasmas 3, 2903 共1996兲. 8 D. Newman, B. A. Carreras, P. H. Diamond, and T. S. Hahm, Phys. Plasmas 3, 1858 共1996兲. 9 T. Huld, A. H. Nielsen, H. L. Pe´cseli, and J. Rasmussen, Phys. Fluids B 3, 1609 共1991兲. 10 D. E. Newman, B. A. Carreras, D. Lo´pez-Bruna, P. H. Diamond, and V. B. Lebedev, Phys. Plasmas 5, 938 共1998兲. 11 D. Lo´pez-Bruna, D. E. Newman, B. A. Carreras, and P. H. Diamond, Phys. Plasmas 6, 854 共1999兲. 12 J. W. Connor, P. Buratti, J. G. Cordey, C. Hidalgo, A. Jacchia, U. Stroth, and W. Suttrop, Plasma Phys. Controlled Fusion 41, 693 共1999兲. 13 E. Sa´nchez, C. Hidalgo, M. A. Pedrosa, R. Balbı´n, B. van Milligen, and I. Garcı´a-Corte´s, Contrib. Plasma Phys. 38, S93 共1998兲. 14 C. Hidalgo, M. A. Pedrosa, I. Garcı´a-Corte´s, E. Sa´nchez, R. Balbı´n, B. van Milligen, C. Silva, H. Fernandes, H. Figueiredo, C. Varandas, C. Ricardi, D. Madella, R. Carrozza, D. Mozzi, M. Fontaseni, L. Garcı´a, M. Endler, S. Davies, G. F. Mathews, and B. A. Carreras, in Plasma Physics and Controlled Fusion Research, Proceedings of the 17th Conference on Plasma Physics and Controlled Nuclear Fusion Research, Yokohama 共International Atomic Energy Agency, Vienna, 1998兲. 1
2
Sa´nchez et al.
Phys. Plasmas, Vol. 7, No. 5, May 2000 15
C. Hidalgo, C. Silva, M. A. Pedrosa, E. Sa´nchez, H. Fernandes, and C. Varandas, Phys. Rev. Lett. 83, 2203 共1999兲. 16 J. F. Lyon, B. A. Carreras, K. K. Chipley, M. J. Cole, J. H. Harris, T. C. Jernigan, R. L. Johnson, V. E. Lynch, B. E. Nelson, J. A. Rome, J. Sheffield, and P. B. Thompson, Fusion Technol. 10, 179 共1986兲. 17 H. Renner and the W7-AS team, Plasma Phys. Controlled Fusion 31, 1579 共1989兲. 18 E. Bertolini and the JET Team, Fusion Eng. Des. 30, 53 共1995兲. 19 C. Riccardi, M. Fontanesi, A. Galassi, and E. Sindoni, Plasma Phys. Controlled Fusion 36, 1911 共1994兲. 20 G. F. Matthews, Plasma Phys. Controlled Fusion 36, 1595 共1994兲. 21 C. Hidalgo, J. H. Harris, T. Uckan, J. D. Bell, B. A. Carreras, J. L. Dunlap, G. R. Dyer, C. P. Ritz, A. J. Wootton, M. A. Meier, T. L. Rhodes, and K. Carter, Nucl. Fusion 31, 1471 共1991兲. 22 Ch. P. Ritz, H. Lin, T. L. Rhodes, and A. J. Wootton, Phys. Rev. Lett. 65, 2543 共1990兲. 23 I. Garcı´a-Corte´s, M. Endler, A. Loarte, S. J. Davies, S. K. Erents, H. Guo, C. Hidalgo, J. Lingertat, J. R. Martı´n-Solı´s, G. F. Matthews, B. Van Milligen, R. D. Monk, R. Simonini, and A. Taroni, Proceedings of the 24th EPS Conference on Controlled Fusion and Plasma Physics, Berchtesgaden, 1994 共European Physical Society, Pefit-Lancy, 1994兲, Vol. 21A, Pt. I. p. 109. 24 G. C. Sethia and D. Reddy, Phys. Plasmas 2, 1989 共1995兲. 25 C. Riccardi, D. Xuantong, M. Salierno, L. Gamberale, and M. Fontanesi, Phys. Plasmas 4, 3749 共1997兲. 26 For a Poisson distribution the skewness is S⫽ /⫽1/冑, being the mean value of the distribution. 27 O. Kofoed-Hanse, H. L. Pe´cseli, and J. Trulsen, Phys. Scr. 40, 280 共1989兲. 28 J. N. Leboueuf, L. A. Charlton, and B. A. Carreras, Phys. Fluids B 5, 2959 共1993兲. 29 T. S. Hahm, Phys. Plasmas 1, 2940 共1994兲.
Downloaded 10 Oct 2000 to 130.206.11.122.Redistribution subject to AIP copyright, see http://ojps.aip.org/pop/popcpyrts.html.