Page 1. Large-scale behavior of the tokamak density fluctuations. G. M. Zaslavsky. Courant Institute of Mathematical Sciences, New York University, New ...
PHYSICS OF PLASMAS
VOLUME 7, NUMBER 9
SEPTEMBER 2000
Large-scale behavior of the tokamak density fluctuations G. M. Zaslavsky Courant Institute of Mathematical Sciences, New York University, New York, New York 10012 and Department of Physics, New York University, New York, New York 10003
M. Edelman and H. Weitzner Courant Institute of Mathematical Sciences, New York University, New York, New York 10012
B. Carreras Oak Ridge National Laboratory, Oak Ridge, Tennessee 37831-8070
G. McKee University of Wisconsin/General Atomics, San Diego, California 92186-5608
R. Bravenec University of Texas, Austin, Texas 78712
R. Fonck University of Wisconsin/General Atomics, San Diego, California 92186-5608
共Received 29 February 2000; accepted 10 May 2000兲 An analysis of tokamak density fluctuations data permits the determination of two characteristic exponents. The exponents correspond to the powers of a power-law dependence of the distributions of the long-lasting monotonic change 共‘‘flight’’兲 of the density and the time length of these changes. Speculation based on these results leads to construction of the fractional kinetic equation for the distribution function of the flights. The asymptotic transport properties of the particle density distribution function are directly connected with the exponents obtained from the density fluctuations data. © 2000 American Institute of Physics. 关S1070-664X共00兲04008-8兴
I. INTRODUCTION
reference to density fluctuation data taken at the plasma core close to the edge. In fact, there can be different scaling ranges which depend not only on where the measurements are performed, but in what regime of the device the data were taken. For example, on the question of the role of internal magnetic islands versus separatrix effects, we might suggest the study of probe measurements within the plasma versus the same fluctuation measurements in the scrape-off layer. Such data are available and could be used for further work. We also mention earlier references on the related issue.1,2 It is a common view that the plasma fluctuations in different devices are a result of the complex interaction of nonlinear processes, chaotic dynamics, self-organization, etc., and that these fluctuations may display a self-similar space– time pattern. Support for this new approach may be found in the data analysis in Refs. 1–3. The so-called self-organized criticality 共SOC兲 concept4 has been exploited as a model to represent typical general features of plasma fluctuations.5–8 The Hurst exponent9,10 has been calculated in Refs. 2 and 3 to describe some fractal properties of the time series of the density fluctuations obtained from different plasma devices. Speculations based on a running sand-pile model were the subject of serious articles,5–8 where the large-scale plasma behavior was discussed on the basis of the SOC concept. Although some self-similarity properties observed in the plasma devices are in direct analogy with phenomena of some regimes of sand-piles, this concept by itself does not, at present, lead to a direct determination of a transport model
This paper gives an example of how data analysis of the long-time density fluctuations in a fusion-relevant plasma permits the determination of some of its large-scale spatial properties. In order to control a large, hot plasma in a quasistationary regime, one can try to develop a ‘‘phenomenology’’ of its dynamics. In part, the phenomenology should appear as a result of coarse-graining microscopic observations, i.e., small scale space–time processes. Such analysis should lead to the description of some of the large scale space–time processes in terms of small scale processes. Although there is now a rough consensus on what features of the hot plasma should be considered as its large-scale characteristics, we note that small scale phenomena, such as the presence of many magnetic islands, divertor effect, scrapeoff layer physics, etc., can influence the macroscopic dynamics. In line with this approach to the phenomenology we would expect such properties as intermittency and coherent structures to appear in the data. If this goal is realized, the proposed style of analysis would also provide guidance for planning of data acquisition and processing systems for future experiments, so that one might observe correlation between changes of different global properties of fusion plasmas and changes observed by the massive data analysis. The first question that arises immediately from the preamble is: Is there any indication that from the already known microscopic data there are any large-scale stable characteristics of the tokamak? The purpose of this paper is to answer ‘‘yes’’ to this question. We will address this question by 1070-664X/2000/7(9)/3691/8/$17.00
3691
© 2000 American Institute of Physics
Downloaded 22 Feb 2007 to 128.104.198.190. Redistribution subject to AIP license or copyright, see http://pop.aip.org/pop/copyright.jsp
3692
Zaslavsky et al.
Phys. Plasmas, Vol. 7, No. 9, September 2000
applicable to the physical processes in the devices. An alternate way to examine the self-similarity of the field and density fluctuations is based on the use of models of stochastic processes that are far beyond simple Gaussian processes and that can take into account the effects of memory, intermittency, and fractality in ways that can be explicitly connected to the basic plasma dynamics physics. Examples of such different possibilities of stochastic processes are Le´vy-type processes,11 Weierstrauss random walks and their modeling of the fractal-time processes,11,12 and fractional kinetics phenomenology introduced in Ref. 13 and applied to some dynamical systems.14 The essential value in the use of fractional kinetics is the possibility to make an explicit connection between critical exponents of the anomalous transport process and specific features of the dynamics such as ‘‘flights’’ and ‘‘trapping time’’ distributions, both of which are imposed by specific physical phenomena. We include in the term ‘‘flights’’ not only Le´vy flights 共see, for example, Ref. 11兲, but also generalized almost-regular bursts in evolution of the system, appearing as a kind of singularity and induced by intermittency, and nearness to a bifurcation point, etc.15 Some self-similar regimes of the running sand-pile model can be successfully interpreted from the fractional kinetics point of view.16 Not much has been done to explain how the fractional kinetics can be applied straightforwardly to plasma devices. As examples, we mention fractional kinetics of passive particles in the helical flow,17 where the hierarchical set of islands in the phase space was pointed out and which defines the anomalous features of the transport; and the attempt 共far from being completed兲 to find a connection between different scales of particle transport and different regimes of the nonlinear dissipative plasma model.18 The goal of this paper is not only to show the existence of the self-similarity of the density fluctuations data obtained from the DIII-D tokamak,19 but also to emphasize the idea of the necessity of the broad screening of similar data in relation to the manner, specific regime, and specific place of the data acquisition. II. ORIGIN OF THE ANOMALOUS PROPERTIES OF FIELDS AND PARTICLE DYNAMICS
Plasma instabilities are a natural cause of loss fast particles confinement from the volume. Even after averaging over spatial–temporal periods of microoscillations, the evolution of the macroscopic time–space phenomena should appear. Two examples of the origin of the large scale phenomena include the following. 共a兲 Quasistationary plasmas confined in a threedimensional magnetic configuration possess an underlying magnetic field structure of numerous magnetic islands. Even in a two-dimensional configuration, spontaneous symmetry breaking can lead to a similar situation.20 The relative importance of such magnetic structures has been a long-standing controversial issue.21,22 However, as more fine-scale electron temperature measurements become available, there is more evidence of magnetic structures in confined plasmas.23,24 Detailed information on the nature, volume, and origin of these islands is limited. Nevertheless, on the basis of recent results
for the magnetic field lines behavior, we can state that the boundary of an island may be ‘‘sticky,’’ i.e., it can attract particle trajectories for some period. This mechanism of the induced ballistic transport differs strongly from the normal, Gaussian type, diffusion. Not all islands are sticky, and those that are sticky generate different transport anomalies.15 Independent of the variability of sticky islands, the anomalous transport of field lines or particles can be expressed in the form
具 R 2 典 ⬃t
共1兲
with a transport exponent ⬎1. This phenomenon is called superdiffusion. 共b兲 The magnetic field structure at the plasma edge is strongly affected by the presence of a separatrix in magnetic field structure. Thus, a topological effect intervenes in the large-scale particle dynamics through the influence of a specific type of divertor, limiter, etc. Depending on control parameters of the field geometry, ballistic islands may appear in the vicinity of the separatrix25 leading to anomalous transport in the poloidal and toroidal directions. Such transport will be reflected in the large scale properties of the distribution function of particles. 共c兲 Global constraints, such as profile consistency26 induced by self-organization dynamics close to a marginal point, can cause an increase in the transport that is characterized by multiple space scales. This phenomenon can also be the cause of anomalous diffusion, exhibited in Eq. 共1兲, which is also contained in the distribution of ‘‘flights,’’ and which we introduce later. Whatever dynamical cause of the anomalous diffusion, the phenomenon may be responsible for some of the experimental observations in magnetically confined plasmas, such as the Bohm scaling of the diffusivities of the low confinement mode and the apparently nonlocal behavior of some perturbative experiments. From very general considerations one expects that particle density distribution in space and time will have a tail, and that the tail is a complex result of the major large-scale plasma properties. Further, the tail of the distribution, in a simplified version, can be approximated by the distribution function n t 共 x,t 兲 ⬃t 1 f 共 x/t 2 兲 .
共2兲
The exponents 1 , 2 in 共2兲 and in 共1兲 should be coupled to the large scale factors that govern the long-lasting fluctuations, i.e., for example, to the magnetic islands and the fieldlines topology. In fact, expressions 共1兲 and 共2兲 are oversimplified models which can be replaced by a more realistic situation that involve some distribution of values , 1 , 2 near their fundamental magnitudes. We discuss this issue further in Sec. VII. The first step in checking the relevance of this approach to microscopic and macroscopic properties is to analyze the data and to validate the existence of a scaling behavior of the density distribution. Similarity conditions, such as the one given by Eq. 共2兲, have already been investigated for the probability distribution function of the density fluctuations, plasma potential
Downloaded 22 Feb 2007 to 128.104.198.190. Redistribution subject to AIP license or copyright, see http://pop.aip.org/pop/copyright.jsp
Phys. Plasmas, Vol. 7, No. 9, September 2000
Large-scale behavior of the tokamak density fluctuations
fluctuations, and the induced turbulent particle flux.1,2,27 However, one difficulty often encountered is how to make a reliable determination of the exponents in the tail part of the distribution function of density fluctuations or other extents. The techniques developed here improve the calculation of the exponents over previous determinations.
This analysis method is applied to the multichord beam emission spectroscopy 共BES兲 data from the DIII-D tokamak. In the present analysis, we have considered the discharge 92 409 for several reasons. This shot was a relatively lowpower negative-shear discharge. For this discharge, the data were collected during its early phase, therefore, there was no q⫽1 surface in the plasma. This eliminates any possible sawtooth oscillations that could add a serious complication in the fluctuation analysis. There was also no evidence in this shot of spurious beam oscillations. Finally, during the time range analyzed, there was no evidence of any coherent mode activity. The DIII-D BES system has 25 channels,19 and gives fluctuation measurements at radial positions separated by about 1 cm. For each channel we have a time record of 250 000 points. Data were collected with a sampling rate of 1 MHz. Here, we have considered data from those 6 channels closest to the plasma edge. Over the shortest time scales, the BES fluctuation measurements are affected by photon noise. This noise is not important for the present studies because our analysis is focused on larger time scales. Furthermore, the analysis shows how we can overcome this contamination. On the other hand, on larger scales, the BES fluctuation measurements can be affected by the so-called common mode, oscillations induced in the beam by the fluctuations at the plasma edge. However, since we are analyzing data relatively close to the plasma edge, it is not necessary in this study to correct for the common mode. IV. FRACTIONAL EXPONENTS
We consider a sequence of density fluctuation measurements 兵 x i 其 at a fixed radial location. We define the cumulative density at a given point in space and at the time t n as n
兺
j⫽1
xj .
共3兲
The density x j ⬅x(t j ) is measured at the time t j . For large n⫽NⰇ1 the mean square fluctuation is
具 兩 ␦ S 共 N 兲 兩 2 典 ⫽ 具 兩 S N ⫺ 具 S N 典 兩 2 典 ⬃N.
general, S n admits fluctuations which do not follow the Gaussian distribution, but which possess power-like tails and infinite high moments. Let us consider probability distribution function 共PDF兲 P(⌬S) of fluctuations ⌬S n for different time instants n: ⌬S n ⬅⌬S n,N ⫽S n ⫺ 具 S N 典 n,
共5兲
where N is the length of the time series and
III. DESCRIPTION OF THE DATA
S n ⫽S 共 t n 兲 ⫽
3693
共4兲
The mean square fluctuation is proportional to N if the large number law can be applied, or if the sequence x j represents, particularly, Gaussian process. It is known from numerous observations of nonplasma systems that the property 共4兲 can be very poor and sometimes does not reflect specific features of a system and, more specifically, its fractal properties, which typically are attributed to some turbulent process. In
具 S N 典 ⫽S N /N.
共6兲
Particularly, for n⫽N we have simply ⌬S N ⫽0. For white noise, P(⌬S) is Gaussian, while for processes that obey fractional kinetics we expect P 共 ⌬S 兲 ⬃1/兩 ⌬S 兩 ␦
共 兩 ⌬S 兩 →⬁ 兲 .
共7兲
So far, the variable ⌬S has not been adequately defined in a way to extract a large scale asymptotics. To do so, we have to consider ⌬S averaged over different time scales. Therefore, let us introduce a coarse-graining of ⌬S corresponding to a ‘‘boxing’’ for the set 兵 ⌬S n 其 : (k⫹1)a
⌬S k ⫽ 共 1/a 兲
兺
j⫽ak⫹1
⌬S j ,
共8兲
where a is an integer that defines a size of the box. Expression 共8兲 means that instead of the set of k values (⌬S ak⫹1 , . . . ,⌬S ak⫹a ) we consider the mean value ⌬S k located at the time interval (ak⫹1,ak⫹a). In Fig. 1 we present the density fluctuation data 兵 x j 其 for one of the BES channels. The data do not show any significant feature but noise. The situation does not change even after smoothing of 兵 x j 其 over the nearest 60 points. This is possibly due to the photon noise that is large at small time scales. The pattern becomes different when we consider ⌬S, defined in 共5兲, versus n 共Fig. 2兲. A simple look at the new series 兵 ⌬S k 其 , which have a length k max⫽N/a, displays two types of behavior: fairly long-lasting, almost monotonic, segments of the sequence which we will call ‘‘flights’’ and segments with small-scale regular fluctuations. We filter the short-scale fluctuations using a smoothing over the length a and consider only large-scale flights. Consider an example of a sequence ⌬S k ⬍⌬S k⫹1 ⬍ . . . ⬍⌬S k⫹m , ⌬S k⫹m⫹1 ⬍⌬S k⫹m ,
⌬S k⫺1 ⬎⌬S k ,
共9兲
i.e., the set ⌬S j has monotonic changes from j⫽k to j⫽k ⫹m. We shall call the sequence 共9兲 a flight. Denote ⌬n a to be a length of the monotonic part of ⌬S k , i.e., the length of a flight. This means that ⌬n a takes values:
兵 ⌬n a 其 ⫽ 兵 a,2a,3a, . . . 其 .
共10兲
For the example 共9兲, the length of the flight is ⌬n a ⫽ma. The flights can be defined in both ‘‘directions,’’ i.e., as monotonic increasing or monotonic decreasing of ⌬S j . Then P(⌬n a ) is PDF of the length of flights, i.e., time intervals of a monotonic variation of the cumulative density. It will be demonstrated in Sec. V that P(⌬n a ) possesses the asymptotic behavior as
Downloaded 22 Feb 2007 to 128.104.198.190. Redistribution subject to AIP license or copyright, see http://pop.aip.org/pop/copyright.jsp
3694
Zaslavsky et al.
Phys. Plasmas, Vol. 7, No. 9, September 2000
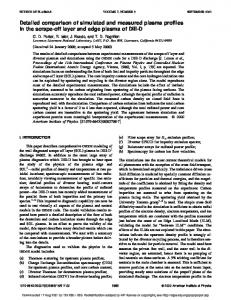
FIG. 1. Two examples of the raw data for density x n at time instant n ‘‘smoothed,’’ i.e., averaged over 3 nearest values 共a兲 or over 61 nearest values 共b兲.  P 共 ⌬n a 兲 ⬃1/⌬n 1⫹ a
共11兲
for some interval of values of ⌬n a , and that result is stable with respect to different choices of the value of a. In a similar way we may introduce a change of ⌬S during the flight, i.e., s m ⬅⌬S k⫹m ⫺⌬S k
共12兲
for a flight of the length m, and consider a PDF P(s) of the cumulative density changes during flights. In other words, P(s) is a distribution function of the cumulative density fluctuations. A specific feature of that density is that we consider only long-lasting fluctuations. It will be seen in Sec. V that P 共 兩 s 兩 兲 ⬃1/兩 s 兩 1⫹ ␣ .
共13兲
We postpone until later the discussion of the connection between P(⌬n) and P( 兩 s 兩 ).
FIG. 2. Values of integral density fluctuation ⌬S n vs time n: raw data 共a兲 and two different zooms 共b兲,共c兲.
V. RESULTS FROM THE DATA
In Fig. 2 we present 兵 ⌬S k 其 without boxing (a⫽1). Figure 2 displays numerous flights as well as short-scale noisy parts. Figure 3 presents P(⌬n 50) and P(⌬n 25), and these distributions indicate a power law dependence of the tail.
Downloaded 22 Feb 2007 to 128.104.198.190. Redistribution subject to AIP license or copyright, see http://pop.aip.org/pop/copyright.jsp
Phys. Plasmas, Vol. 7, No. 9, September 2000
Large-scale behavior of the tokamak density fluctuations
3695
FIG. 4. Distribution of the values of the integral density fluctuations S ⫽S 25 during one ‘‘flight,’’ i.e., large-scale fluctuations.
presence of fractal structures and self-similarities in the data can be obtained by applying a wavelet transform: Pˆ 共 ;b 兲 ⫽
冕
⬁
⫺⬁
d 共 ⌬n 兲 K 共 ⌬n⫺ ;b 兲 P 共 ⌬n 兲
with a rectangular kernel: 1 K 共 ⌬n⫺ ;b 兲 ⫽ 2b
再
⫺1,
⫺b⬍⌬n⫺ ⬍0
⫹1,
0⬍⌬n⫺ ⬍b
0,
共 ⌬n⫺ 兲 ⬎b
共15兲
冎
共16兲
with the width of the kernel 2b. The results are presented in Fig. 5. They indicate the existence of self-similar structures. The largest time interval is max⌬t⬃75 000; the smallest one is min ⌬t⬃2⫺4 max ⌬t. In this way we confirm the existence of the temporal fractal structure in the density dynamics. FIG. 3. Distribution of the length of ‘‘flights’’ after coarse graining the data for ⌬S over ‘‘boxes’’ of sizes 25 共a兲 and 50 共b兲.
There is no significant difference between P(⌬n 50) and P(⌬n 25). The resulting value for  in 共11兲 is
 ⫽1.4⫾0.2.
共14兲
The region of the significant part of the data extends over 1.5 decades, which is a little less than the desirable few decades of data length. Increasing the statistics is thus necessary, and it could be done by selecting data from different shots with similar conditions. Similar behavior with a power-type dependence is obtained for P( 兩 s 兩 ) with exponent ␣ within this interval (0.6– 1.4) 关see Fig. 4 and definition 共13兲兴. This preliminary analysis shows the presence of intermittent behavior which can be induced by a large-scale physical phenomenon such as the effects of magnetic islands or near-separatrix dynamics. Additional information on the
VI. DESCRIPTION OF THE FRACTIONAL KINETICS
Although the data in Figs. 3 and 4 supporting the powerlaw distributions P(s) and P(n) are already significant for understanding the anomalous large scale plasma behavior, the analysis may be much more effective if we can obtain an equation governing the distribution of density fluctuations. Here, we propose to use phenomenological fractional generalization of the Fokker–Planck–Kolmogorov 共FFPK兲 equation,13,14 which was successfully applied to some chaotic maps15,28,29 as well as to the running sand-pile model.16 For this goal, we introduce a distribution function F s (s,t) that describes only a singular part of the full distribution function F 共 s,t 兲 ⫽F r 共 s,t 兲 ⫹F s 共 s,t 兲 ,
共17兲
where F r (s,t) is the regular part of the distribution function. The F(s,t) has a standard meaning as a probability density to have the particle mass 兩 S 兩 at time t, while the singular part
Downloaded 22 Feb 2007 to 128.104.198.190. Redistribution subject to AIP license or copyright, see http://pop.aip.org/pop/copyright.jsp
3696
Zaslavsky et al.
Phys. Plasmas, Vol. 7, No. 9, September 2000
FIG. 5. Wavelet transform P( ,b) 关see 共5.2兲兴 for b⫽25 and for the coarse-grained data ⌬S n 关see Fig. 2共a兲兴. The values of P are in the intervals: (⫺1; ⫺0.49)—light; (⫺0.49;0)—grey; (0;0.49)—dark gray; (0.49;1)—black.
F s ( 兩 s 兩 ,t) describes only the long-lasting and high-magnitude fluctuations of the mass. Then, for a simplified situation to be discussed later, F s ( 兩 s 兩 ,t) satisfies the FFPK equation
 F s 共 兩 s 兩 ,t 兲 t
⫽D ␣
␣ F s 共 兩 s 兩 ,t 兲 兩s兩␣
⫹st,
共18兲
where D␣ is a constant, ␣ and  can be fractional, and st is a source term 共see more about st in Refs. 30 and 16兲. Equation 共18兲 has, in particular, self-similar solutions of the type of 共2兲,30 and the main problem of finding the solution is to make connection between ␣ ,  ,D␣ , st, and real physical properties. Multiplying 共18兲 by 兩 s 兩 ␣ and integrating it over 兩 s 兩 , we obtain asymptotically when the st is not important: ␣

具 兩 s 兩 典 ⫽constt ,
共 t→⬁ 兲
共19兲
and, in a similar way,
具 兩 s 兩 m ␣ 典 ⬃constt m  ,
共 t→⬁ 兲 .
共20兲
It is convenient to introduce a transport exponent
⫽2  / ␣
共21兲
which, in the case of a full self-similarity, provides
具 兩 s 兩 2 典 ⬃t .
共22兲
Expression 共22兲 does not always follow from 共19兲 and 共20兲, especially in the case of multifractality.29 Equation 共18兲 without the source term is invariant with respect to the scaling transformation of both variables 兩 s 兩 and t. This property can help to establish connection between ␣ ,  and the observed data 共see further details in Refs. 15, 29, and 16兲. For the case considered, we may take ␣ and  exactly the same as defined in 共11兲 and 共13兲, provided there are no other critical exponents that are important for the particle density evolution. Using 共14兲 and value of ␣ from Fig. 4, we arrive at
⬃2.8⫾0.8.
共23兲
It is a difficulty to define more accurately since the value of ␣ , which is close to one, must be determined more precisely. Let us discuss possible interpretations of the value 共23兲 for . In an abstract situation when s is a displacement, ⫽1 corresponds to normal diffusion, 1⬍ ⬍2 means superdiffusion, and ⫽2 is ballistic evolution. In the case of 共22兲, s is integral density during its monotonic evolution 共i.e., ‘‘flight’’兲 and the connection between s and particle dynamics is unknown. Due to this, we have an ambiguity in interpretation of 共22兲 and 共23兲 as either a superdiffusion or superballistic regime. The latter case can appear, for example, if
Downloaded 22 Feb 2007 to 128.104.198.190. Redistribution subject to AIP license or copyright, see http://pop.aip.org/pop/copyright.jsp
Phys. Plasmas, Vol. 7, No. 9, September 2000
Large-scale behavior of the tokamak density fluctuations
integral density grows monotonically due to accumulation of the ballistically moving particles, i.e., 兩 s 兩 ⬃l, where l is a particle displacement. Then the anomalous transport
具 兩 s 兩 典 ⬃t 1.4⫾0.4
共24兲
that follows from 共22兲 is the superballistic one or close to it 共see also Refs. 31 and 32兲. That means a local acceleration of particles during a ‘‘flight.’’ In fact, the connection 兩 s 兩 ⬃l may not exist, and then the superdiffusion will be the major characteristic of the transport process.
VII. DISCUSSION
共25兲
or, using 共22兲 for the left-hand side, and results of Refs. 1 and 2 for the right-hand side t ⬃t 2 t 2H .
共26兲
That yields
⬃2 共 1⫹H 兲 ,
共27兲
⬃ 共 3.2– 3.5兲
共28兲
i.e.,
while our results give
⬃ 共 2 – 3.6兲 .
portance of high accuracy and large statistics for the fluctuation data. We hope that if such data become available, it will not only lead to better information about the core and edge plasma, but will also provide a possibility for precise differentiation of different regimes of tokamak operation. One must note that we have considered the oversimplified situation of pure scaling laws characterized by only two exponents ␣ and  . In fact, one can expect multifractal situations when the transport formulas 共19兲–共22兲 should be improved by introducing multiscaling. We will return to this issue in future publications.
ACKNOWLEDGMENTS
We have discussed two issues related to the tokamak data on the density fluctuations obtained from DIII-D in the region close to the plasma edge. The first is, how to work with the data in order to extract large scale density dynamics. It is worthwhile to mention that the raw data are noisy, and the power-law dependencies of the density not appear explicitly. However, we were able to obtain two important characteristics of the density dynamics: power-type distribution of the density fluctuations and a similar behavior of the time length of these fluctuations. We believe that enriched information can be obtained from different regions of plasmas and then compared. The second issue is related to speculations based on the phenomenologically determined exponents ( ␣ ,  ) for the distributions of the integral density fluctuations and their time length. Using the equation of fractional kinetics, it is possible to couple data to the mass/charge transport through the transport exponent ⫽2  / ␣ . The result obtained for the square fluctuation of the integral density s 2 is 关see 共22兲兴: ⬃2.8⫾0.8. At the same time, the Hurst exponent H for the current obtained from tokamaks data in Refs. 1 and 2: H ⬃0.6– 0.75. A very simplified comparison of the values and H can be obtained in the following way. Let sˆ be a density. Then one can write for the second moment
具 s 2 典 ⬃t 2 具 sˆ 2 典
3697
共29兲
Since the fairly high error bar for the data 共29兲, one may consider the results 共28兲 and 共29兲 reasonably consistent, although we may expect other situation共s兲 when more accurate data and better statistics will be used. This type of study must be extended to include as much fluctuation data as possible. Our results emphasize the im-
G.M.Z. was supported by U.S. Department of Energy Grant No. DE-FG02-92ER54184 and by U.S. Navy Grant N00014-96-1-0055. H.W. was supported by U.S. Department of Energy Grant No. DE-FG02-86ER53223. BAC: Research sponsored by Oak Ridge National Laboratory, managed by Lockheed Martin Energy Research Corp. for the U.S. Department of Energy under Contract No. DE-AC0596OR22464. 1
B. A. Carreras, B. van Milligen, M. A. Pedrosa, R. Balbin, C. Hidalgo, D. E. Newman, E. Sa´nchez, M. Frances, I. Garcia-Corte´s, J. Blueuel, M. Endler, S. Davies, and G. F. Mattews, Phys. Rev. Lett. 80, 4438 共1998兲. 2 B. A. Carreras, B. van Milligen, C. Hidalgo, R. Balbin, E. Sa´nchez, I. Garcia-Corte´s, and M. A. Pedrosa, Phys. Rev. Lett. 83, 3653 共1999兲. 3 C. Hidalgo, M. A. Pedrosa, B. van Milligen, E. Sa´nchez, R. Balbin, I. Garcia-Corte´s, J. Blueuel, L. Giannone, and H. Niedermeyer, in Fusion Energy 1996 共IAEA, Vienna, 1997兲, Vol. 1, pp. 617–624. 4 P. Bak, C. Tang, and K. Weisenfield, Phys. Rev. Lett. 59, 381 共1987兲. 5 P. H. Diamond and S. T. Hahm, Phys. Plasmas 2, 3640 共1995兲. 6 D. E. Newman, B. A. Carreras, P. H. Diamond, and T. S. Hahm, Phys. Plasmas 3, 1858 共1996兲. 7 B. A. Carreras, D. E. Newman, V. E. Lynch, and P. H. Diamond, Phys. Rep. 22, 740 共1996兲. 8 X. Garbet and R. Waltz, Phys. Plasmas 5, 2836 共1998兲. 9 H. E. Hurst, Trans. Am. Soc. Civil Eng. 116, 770 共1951兲. 10 B. B. Mandelbrot and J. W. Wallis, Water Resour. Res. 4, 909 共1969兲. 11 E. W. Montroll and M. F. Shlesinger, in Studies in Statistical Mechanics, edited by J. Lebowitz and E. Montroll 共North-Holland, Amsterdam, 1984兲, Vol. 11, p. 1. 12 B. D. Hughes, E. W. Montroll, and M. F. Shlesinger, J. Stat. Phys. 28, 111 共1982兲. 13 G. M. Zaslavsky, in Topological Aspects of the Dynamics of Fluids and Plasmas, edited by H. K. Moffatt, G. M. Zaslavsky, P. Compte, and M. Tabor 共Kluwer, Dordrecht, 1992兲, p. 481. 14 G. M. Zaslavsky, Physica D 76, 110 共1994兲; Chaos 4, 25 共1994兲. 15 G. M. Zaslavsky, M. Edelman, and B. Niyazov, Chaos 7, 159 共1997兲. 16 B. A. Carreras, V. E. Lynch, D. E. Newman, and G. M. Zaslavsky, Phys. Rev. E 60, 4770 共1999兲. 17 G. M. Zaslavsky, D. Stevens, and H. Weitzner, Phys. Rev. E 48, 1683 共1993兲. 18 S. Benkadda, P. Gabai, and G. M. Zaslavsky, Phys. Plasmas 4, 2864 共1997兲. 19 G. McKee, R. Ashley, R. Durst, R. Fobck, M. Jacubovski, K. Tritz, K. Burrell, C. Greenfield, and J. Robinson, Rev. Sci. Instrum. 70, 913 共1999兲. 20 B. B. Kadomtsev, Nucl. Fusion 31, 1301 共1991兲. 21 J. W. Connor, Plasma Phys. Controlled Fusion 35, 3293 共1993兲. 22 R. J. Bickerton, Plasma Phys. Controlled Fusion 39, 339 共1997兲. 23 N. J. L. Cardozo, F. S. Shu¨ller, C. J. Barth, C. C. Chu, F. J. Pijper, J. Lok, and A. A. M. Oomens, Phys. Rev. Lett. 73, 256 共1994兲. 24 C. Alejaldre and the TJ-II Team, ‘‘First Plasmas in the TJ-II Stellarator,’’ to be published in Nuclear Fusion. 25 V. Rom-Kedar and G. M. Zaslavsky, Chaos 9, 697 共1999兲. 26 B. Coppi, Comments Plasma Phys. Control. Fusion 5, 261 共1980兲.
Downloaded 22 Feb 2007 to 128.104.198.190. Redistribution subject to AIP license or copyright, see http://pop.aip.org/pop/copyright.jsp
3698 27
Zaslavsky et al.
Phys. Plasmas, Vol. 7, No. 9, September 2000
V. Carbone, G. Regnoli, E. Martines, and V. Antoni, Phys. Plasmas 7, 445 共2000兲. 28 S. Benkadda, S. Kassibrakis, R. B. White, and G. M. Zaslavsky, Phys. Rev. E 55, 4909 共1997兲.
29
G. A. 31 G. 32 G. 30
M. Zaslavsky and M. Edelman, Chaos 10, 135 共2000兲. I. Saichev and G. M. Zaslavsky, Chaos 7, 753 共1997兲. Zimbardo, P. Veltri, and P. Pommois, Phys. Rev. E 61, 1940 共2000兲. Zimbardo, A. Greco, and P. Veltri, Phys. Plasmas 7, 1071 共2000兲.
Downloaded 22 Feb 2007 to 128.104.198.190. Redistribution subject to AIP license or copyright, see http://pop.aip.org/pop/copyright.jsp