joints plays an important role in life management of aging aircraft. Pulsed eddy ... shown to effectively characterize hidden corrosion in lap splices. However ...
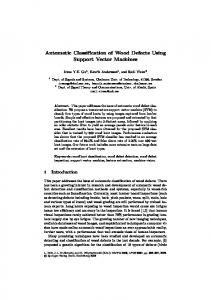
AUTOMATIC CLASSIFICATION AND CHARACTERIZATION OF HIDDEN CORROSION USING PULSED EDDY CURRENT DATA M.S. Safizadeh, Z. Liu, D.S. Forsyth, and A. Fahr Institute for Aerospace Research, National Research Council Canada, Ottawa, Canada Abstract: Detection and characterization of the material loss due to corrosion in aircraft fuselage joints plays an important role in life management of aging aircraft. Pulsed eddy current has been shown to effectively characterize hidden corrosion in lap splices. However, variation of the probe lift-off and interlayer gap can cause false indications or inaccuracy in quantification. This paper presents the results of a project concerned with the development of a technique for automatic material loss characterization based on pulsed eddy current data. The goal of the project was to develop a software tool that would facilitate distinguishing of material loss in multi-layer structures from effects such as probe lift-off and interlayer gap. Following on from previous work addressing the capabilities of time-frequency analysis of pulsed eddy current signals to provide specific visual patterns that can be related to the interlayer gap, lift-off, and material loss, the authors have investigated this method along with an intelligent system to automatically characterize and determine the location of material loss in a two-layer structure. Introduction: The lap joint is a common structural element in transport aircraft. These joints are potentially susceptible to corrosion and fatigue damage, and require non-destructive testing to ensure safety over the life of an aircraft. Nondestructive detection and quantification of corrosion in these multilayered structures is a challenge in which the pulsed eddy current method has shown potential [1,2]. Pulsed eddy current techniques excite the probe’s driving coil with a repetitive broadband pulse, usually a square wave. This changing current through the coil induces eddy currents in the test piece and the associated magnetic field in the material dissipates rapidly and exponentially as it approaches a steady state. The field at the surface of the test specimen is measured with a sensor, which may be the driving coil, another coil, or a Hall or GMR sensor. The resulting pulsed eddy current signals are a series of voltage-time data. Since a broad frequency spectrum is produced, unlike the conventional eddy current testing, the reflected signal contains depth information about the material. Analysis of pulsed eddy current signals in time domain provides some features such as amplitude, time-to-peak or time-to zero-crossing that have been used for detection and characterization of material loss due to corrosion in multi-layer structures. Two of the most important noise sources in lap joint inspections are the variation in probe lift-off and interlayer gap due to change in paint or adhesive thickness, and corrosion pillowing. Previous work of the authors [3] has shown that the time-frequency analysis of pulsed eddy current signals provides visual discrimination between the simultaneous occurrence of material loss and changes in interlayer gap or lift-off. However, this method cannot currently be readily used because of difficulties in calibration and the lack of an automatic detection and classification system. This paper presents a method for automatic analysis of pulsed eddy current signal capable of detecting and classifying the material loss due to corrosion, and determining its location in a twolayer structure. Principal of method: Conventional pulsed eddy current techniques for corrosion detection and characterization rely on the analysis of signal features that are represented as c-scan images. Only experienced operators are able to perform full evaluation of pulsed eddy current c-scan images. Increasing emphasis on reliability and demand for tools that can assist operators have motivated research for an intelligent pulsed eddy current detection and classification system. The automatic pulsed eddy current detection and classification system developed in this work includes three modules: time-frequency analysis module, feature extraction module and classification module, as shown in Figure 1.
PEC signal
Time-Frequency Image Time-Frequency Feature Analysis Extraction
Feature Set
Classification
Defect Class
Figure 1: Modular architecture for the proposed pulsed eddy current system Details about each module are described in the following. Time-Frequency Module: Time-frequency analysis provides a three-dimensional representation of signals in time-frequency-amplitude space, but usually, the projection of this three-dimensional representation is shown in the two-dimensional time-frequency plane with grey scale representing the amplitude. There are several possible time-frequency distributions; however, we will focus only on the Wigner-Ville distribution (WVD) that is most commonly used. The Wigner-Ville distribution of a signal s (t ) is defined as [4]: ∞
WVDs (t , ω ) = ∫ s (t + τ / 2) s ∗ (t − τ / 2)e − jωτ dτ −∞
(1)
where s (t ) is a continuous complex signal, τ is a time shift variable and the asterisk denotes the complex conjugation. The WVD has a number of desirable mathematical properties such as time and frequency marginal conditions, instantaneous frequency, time shift, frequency shift, time and frequency support properties. Despite the desirable properties of the WVD, it has two major draw-backs: it is not necessarily non-negative and it is a bilinear function producing interferences or cross terms for multi-component signals. In practical applications, the WVD requires some smoothing in order to suppress the cross terms. The discrete-time and discrete-frequency version of equation (1) is given by [5]:
WVDs (n, πm / M ) = 2
M /2
∑ p (k ) s (n + k ) s
∗
(n − k ) exp(− j 2πmk / M )
k = − M / 2 +1
(2)
m = 0,1,2,Κ , M − 1 where p (k ) is the window function such as Hamming, Hanning, or rectangle with the length M centred about n . Feature Extraction Module: In automatic pattern recognition and classification systems, the number of features determines measurement cost. The feature extraction module is implemented for mapping the original measurement into a relatively short vector representing features relevant for classification. The output of the time-frequency analysis module is the WVD representation of the pulsed eddy current signals, which are images with a large amount of redundant information. To improve computational efficiency, it is vital to reduce the number of parameters (inputs) in the classifier. The best known linear feature extractor for this task is principal component analysis (PCA). PCA is a method of identifying patterns in data (the time-frequency images of the PEC signals in our case), and expressing the data in such a way as to highlight their similarities and differences. PCA computes the m largest eigenvectors of the d × d covariance matrix of the n × d dimensional patterns. The linear transformation is defined as: Y = HX (3) where X is the given n × d pattern matrix, Y is the derived n × m (m < d ) pattern matrix, and H is the d × m matrix of linear transformation whose columns are the eigenvectors. Since PCA only retains the most expressive features (eigenvectors with the largest eigenvalues), it effectively reduces the number of dimensions without much loss of information.
Let each WVD image be a N × N matrix. This matrix can be expressed as a N 2 -dimensional vector where the rows of pixels in the image are placed one after the other to form a onedimensional image. WVD = ( w11 w12 Κ w1N w21 Κ wNN ) (4) The values in the vector are the intensity values of the image, possibly a single greyscale value. All the WVD image vectors are then put in one matrix:
Image Vector 1 Image Vector 2 X = Μ Image Vector n
(5)
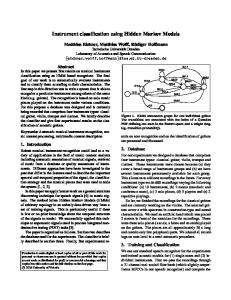
which gives us a starting point for our PCA analysis. Since all the vectors are N 2 dimensional, we will get N 2 eigenvectors. Once we have performed PCA, we obtain the original data mapped into the axis corresponding to the eigenvectors. In practice, we are able to leave out some less significant eigenvectors. In our case, two eigenvectors that correspond to the two largest eigenvalues are chosen for investigation. This choice of eigenvectors permits a visual examination of the data. The output from the PCA module is an optimal set of features extracted from WVD images that are then fed to the classification module. Classification Module: The role of the classification module is to classify or describe observations relying on the extracted features. The classification scheme is usually based on the availability of a set of patterns that have already been classified or described. This set of patterns is termed the training set and the resulting learning strategy is characterised as supervised. Learning can also be unsupervised, in the sense that the system is not given an a priori labelling of patterns, instead it establishes the classes itself based on the statistical regularities of the patterns. The classification scheme usually uses one of the following approaches: template, statistical (or decision theoretic), syntactic (or structural), or neural. In template matching, a template or a prototype of the pattern to be recognized is available. Statistical pattern recognition is based on statistical characterisations of patterns, assuming that the patterns are generated by a probabilistic system. Structural pattern recognition is based on the structural interrelationships of features. Neural pattern recognition employs the neural computing paradigm that has emerged with neural networks. In our case, a supervised linear classifier based on normal densities for all classes is implemented to take care of the last processing step that consists of the decision making regarding the defect class. This classifier is chosen for its simplicity, and because it appears to provide a reasonable classification performance in most applications. It estimates the mean and covariance matrices from the learning set, supposes the different classes have identical covariance matrices, and it is designed based on the optimal Bayes decision rule (called Bayes-normal-linear). Details about this classifier and other classifiers can be found in [6]. Experiments: The PEC instrumentation used for this work consisted of a pulse generator, a preamplifier, an XY positioning robot and a computer-controlled data acquisition system. A schematic of this setup is shown in Figure 2. The driver coil is excited with a 12 volt, 500 µs long step function triggered upon the probe’s arrival at a point of acquisition. The signal is measured as a time-based voltage drop across a resistor in series with the pick-up coil, and fed into a low-noise amplifier. This signal response in the time domain is often called an A-scan. The scanning and data acquisition operations are controlled by the Utex Winspect™ software package. Although the system can accommodate several probe-coil configurations, only the
sliding probe arrangement was used in this study. The probe consists of two adjacent coils in driver/pickup configuration. Pulse Generator Trigger
PC based 16-bit Digitizer
Low Noise Amplifier Probe Adapter Circuit Box Step Function voltage signal Coil transient signal
Eddy Current Probe Specimen on scanning table
Computer Monitor
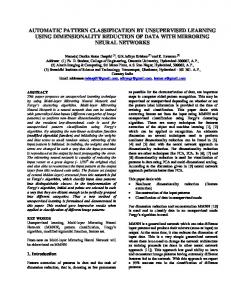
Figure 2. A schematic illustration of the PEC apparatus used in this study. A test specimen was constructed to simulate a two-layer 0.080”/0.080” aluminium alloy lap splice, as shown in Figure 3. Material loss due to corrosion was simulated by two milled areas. Various configurations were arranged to represent the three locations of metal loss: bottom of the top layer (BOT), top of the bottom layer (TOB), and bottom of the bottom layer (BOB). 1 mm thick 2024-T3 Al alloy plate
15.9%
Scan area
13.6% 11.6% 9%
6%
3.3%
1.9%
Fasteners
Milled area on the bottom of top layer the top of bottom layer
15.1% 12.3%
10.1% 7.7%
5.3%
2.7%
1.5%
Figure 3. The configuration of the test specimen used in this study. Each specimen configuration was scanned at a 1 mm resolution. The signals in each region of interest were captured with 1 MHz sampling frequency. It is the reference subtracted signal, rather than the raw signal, that is analysed when evaluating the condition of the lap splice. The reference signal was taken as the average of all A-scan signals in the region away from flaws. Subsequently, the reference signal was subtracted from those of interest, resulting in a set of reference subtracted signals. These represent the perturbations due to metal loss or other abnormal conditions. Hence forth, these signals will be referred as simple PEC signals. Results and Discussion: The subtracted defect signatures are fed to the WVD computer block to obtain the corresponding WVD images. These WVD images are presented to the corresponding PCA block for optimal features extraction. Six different defect classes are considered to test the
performance of the proposed method. There are three categories for the location of defect: bottom of top layer, top of bottom layer and bottom of bottom layer. Each category is divided in two classes: defect with less than 10% of the layer thickness and defect with more than 10% of the layer thickness. The extracted features corresponding to the six simulated defect signatures are fed to the classifier for training. Every training input data is labelled with its corresponding class as indicated in table 1. Table 1: List of defect classes and training data set
Defect Class
Training Data bot 1.9% bot 6% bot 11.6% bot 15.9% tob 1.5% tob 5.3% tob 10.1% tob 15.1% bob 1.5% bob 7.7% bob 10.1% bob 15.1% bob 13.6%
Bottom of top layer defect with less than 10% material loss (BOT 10%) Top of bottom layer defect with less than 10% material loss (TOB 10%) Bottom of bottom layer defect with less than 10% material loss (BOB 10%)
The classifier uses these training data to provide the decision boundary, as shown in Figure 4. Then, the trained classifier assigns the test data to one of the classes under consideration based on the measured features.
BOB 10%
BOT 10%
Figure 4: plot of 6-classes created by the classifier on the PCA results The asterisk marks on the figure 4 indicate the test data that are used for evaluation of the proposed method. To get a better sense of the results, the defect classes determined by the classifier for test data are compared with the actual material losses shown in Figure 3. Figure 5 shows the defect size and its location obtained by classifier in the case of top of bottom and bottom of top defects. The material losses that are not indicated are used for training data.
Actual bot 13.6% Class BOT> 10%
Actual bot 9% Class BOT> 10%
Actual bot 3.3% Class BOT< 10%
Actual tob 12.3% Class TOB< 10%
Actual tob 7.7% Class TOB< 10%
Actual tob 2.7% Class TOB< 10%
Figure 5: Estimated material loss by classifier Table 2 summarizes the defect classes, the actual material losses and the evaluation for the test data. Table 2: comparing actual material losses with defect classes obtained by classifier
Actual Material Loss bot 3.3% bot 9% bot 13.6% tob 2.7% tob 7.7% tob 12.3% bob 1.9% bob 2.7% bob 3.3% bob 5.3% bob 6% bob 9% bob 11.6% bob 12.3% bob 15.9%
Defect Class BOT < 10% BOT > 10% BOT >10% TOB 10% BOB < 10% BOB > 10% BOB > 10% BOB > 10% BOB > 10% BOB > 10%
Evaluation True False True True True False True True False True False False True True True
It is clear from table 2 that in the most of cases the classifier gives a correct response except that when the material loss size is very close to the limit of class such as 9% material loss. However there are some error sources that must be addressed. The extractor block only provided two features for each WVD images to permit a visual examination of the data. The PCA analysis can extract more features to better represent the WVD images. In other word, the loss of information brought on by the PCA analysis can be kept at a minimum.
The number of training samples plays important role in the classification performance. In practice, the error rate of a recognition system is a function of the number of training and test samples. The error rate become smaller and smaller as the ratio of the number of training samples per class to the dimensionality of the feature vector gets larger and larger. In our case, there was only two data per class for training the classifier. That is a very good result with minimum training data. A large number of training data can significantly improve the performance of classifier. It is also noted that the classifier approach adopted in the classification block is the simplest classifier. Using a nonlinear classifier or another kind of classifier can better define the decision boundaries and consequently reduce the error. Conclusions: In this paper, an intelligent detection and classification system based on the pulsed eddy current measurements for automatic characterization of material loss in multi-layer structures has been developed. The application of joint time-frequency analysis and pattern recognition to pulsed eddy current signals provide an automatic defect classification system and expand the role of pulsed eddy current technique in the characterization of hidden corrosion in multi-layer lap splice specimens. The performance of the proposed system has been demonstrated using a two-layer specimen with milled regions to simulate hidden corrosion in lap splice. The results demonstrate the potential of the proposed method for automatic characterization and classification of material loss in multilayer structures. References: 1. Lepine B.A., Wallace B.P., Forsyth D.S., and Wyglinski A., “ Pulsed eddy current method developments for hidden corrosion detection in aircraft lap splices.” Proceedings of the 1st PanAmerican Conference for Nondestructive Testing, Sept 1998. 2. Bieber J.A., Tai C., and Moulder J.C., “ Quantitative assessment of corrosion in aircraft structures using scanning pulsed eddy current.” Review of Progress in Quantitative Nondestructive Evaluation, 17, 1998, PP. 315-322. 3. Safizadeh M.S., Lepine B.A., Forsyth D.S., and Fahr A., “ Time-Frequency Analysis of Pulsed Eddy Current Signals,” Journal of Nondestructive Evaluation, Vol.20, No. 2, PP. 73-86, June 2001. 4. Cohen L., “Time-Frequency Analysis,” Prentice Hall, 2000 5. Classen T.A.C.M., Mecklenbrauker W.F.G., "The Wigner Distribution – A Tool for TimeFrequency Signal Analysis", Philips J. Res., 35, 1980, PP. 217-250, 276-300, 372-389. 6. Jain A.K. Dulin R.P.W. and Jianchang M.,”Statistical Pattern Recognition: A Review”, IEEE Transaction on Pattern Analysis and Machine Intelligence, Vol. 22, No. 1, January 2000.