AlgoViz - a Computer Graphics Algorithm Visualization Toolkit. First Author .... Using this technique Java programs run on Windows, Linux, and. Macintosh.
Technical Report TUBS-CG-2003-12
AlgoViz – A Computer Graphics Algorithm Visualization Toolkit
Torsten Ullrich, Dieter W. Fellner {t.ullrich,d.fellner}@tu-bs.de
Institute of Computer Graphics University of Technology Mühlenpfordtstr. 23, D-38106 Braunschweig http://graphics.tu-bs.de
c Computer Graphics, TU Braunschweig, 2003 �
AlgoViz - a Computer Graphics Algorithm Visualization Toolkit First Author, Affiliation, Country, Email Address Second Author, Affiliation, Country, Email Address
Abstract: This paper presents the new software environment AlgoViz, which enriches computer graphics teachings in a novel way. The AlgoViz project provides a software environment, which is currently focused on the visualization of fundamental computer graphics algorithms and geometric modeling concepts. The intention is not to build yet another static collection of ready-made example applications, whose rigid concept neither permits creativity nor enhancements, but a platform of components, that can be easily combined to new applications. Using a purely visual programming paradigm, AlgoViz offers the possibility to create new demo applications without having to write a single line of source code. The building block concept provides full programming capabilities and flexibility despite its easy handling. Therefore, the project simultaneously two user groups: lecturers, who want to visualize algorithms efficiently, and students, who need to familiarize themselves with computer graphics algorithms at all levels. Hence, the possible range of applications can vary from creating interactive demos for a lecture to composing Java Applets for a drill-and-practice graphics lab where students work on their own.
1
Introduction
Over the years e-learning has become an important internet application, which enriches teachings in several aspects. New media objects and new hardware generations provide visualization technologies beyond the classical video film presentations. For the understanding of complex systems visualization has always been a very important aspect. Especially in natural sciences problems often show dynamic behavior and are difficult to describe. Therefore, videos, simulations, and interactive animations assist an instructor and can make teaching and studying much easier. In general, there is a distinction between synchronous and asynchronous learning scenarios: In a synchronous scenario teachers and students meet at the same time (not necessarily at the same place). The transmission of lectures over a network is an example of such a scenario. Asynchronous scenarios distinguish themselves by a temporal disconnection of teachers and students. For example, learning materials that are published on a server are part of an asynchronous scenario. Learners can download them as they want and work on them at their preferred time. Especially for repetition and intensification of acquired knowledge in the context of blended learning this scenario takes place.
2
Previous Work and Problems
As the importance of visualizations is well known, a lot of toolkits have been developed to support lecturers and students. Consequently, innumerable projects deal with the problem of producing high quality visualizations and simulations in an efficient way. Interactive Java based components – so called Java Applets – for example, can visualize complicated algorithms including animations in a platform-independent way. They allow to study an algorithm or a concept interactively. Furthermore, these applets can be published via internet and then they are readily accessible all the time, proper access authorization provided. But in contrast to synchronous scenarios, which cause only a modest overhead, the production of interactive components, video clips and multimedia learning materials for asynchronous scenarios is extremely expensive; particularly if the material is didactically prepared for this medium. Procedures that minimize these additional costs are therefore desirable.
Besides financial considerations other aspects also have to be taken into account: • Lack of flexibility, • Limited possibility for improvements or extensions, • Difficulties in adapting and • Restricted support. Most visualization/simulation modules are designed and implemented by a scientific research group to enhance their teaching. They are designed, implemented and published for a specific purpose and are used in a particular context. In most cases these applications offer a limited flexibility, for example, to change some parameters within a fixed range. Using the courseware modules in a different context by recombination of sub-modules is generally not possible. This lack of flexibility matters even more if the user has no options for improvements or extensions – the task an educator is typically confronted with – because of the fact that the source code is usually not published or available. Without source code it is very difficult to adapt a program to a new environment such as an operating system, browser, etc. Distributing an application's source code enables an advanced programmer to adapt a program to his or her individual needs. But only a few educators are prepared or capable to do this. Another problem is the restricted support. Due to the high fluctuation of employees in the higher education the long-term maintenance of a project is not guaranteed. To overcome these disadvantages, we have developed a platform that supports the interactive, simple and efficient (re-)packaging of components to more complex applications or systems instead of yet another collection of readymade sample applications, whose rigid concept neither permits creativity nor enhancements. A single component in this context is a reusable part, which can be used in many different contexts varying from a small button to a file selection dialog or a part of an algorithm. The components offer a well-defined functionality and are self-contained software components. Using these building blocks the AlgoViz system offers possibilities as flexible as writing a program in a traditional coding style on a line per line basis. But in most cases there is no need for writing even a single line of code which significantly improves the productivity and reduces development time. As the construction history of a resulting component is stored in a standardized XML format every application built with AlgoViz can easily be shared with the community to reuse or improve it.
3
AlgoViz in Detail
The AlgoViz project provides a software environment, which offers visualization components for fundamental computer graphics algorithms and geometric modeling concepts. The main idea is to provide a good set of small building blocks and let the user do the rest. The project addresses two distinguished user groups: First, it supports lecturers, who want to efficiently visualize algorithms without having to learn a programming language and to spend a lot of time in writing complete programs. Only the elementary concepts of software design and a basic knowledge of programming paradigms are required. Second, AlgoViz trains students in algorithms in the field of computer science in a drill-and-practice environment. Due to the project's modular structure, it is easy to keep an overview over each generated component. Therefore, this project focuses on high usability, which results in ready-to-use applications after a short period of initial training. Its flexibility is obtained by its building block structure that supports the user's creativity in a natural way. 3.1 Java AlgoViz is implemented in Java using Java Beans. Mind that Java is a programming language as well as a platform for interchangeable applications. The Java programming language is a high-level programming language that is simple to learn, almost object-oriented and highly portable. In addition, Java is well established in computer science. In software engineering object orientation is a paradigm that is based on the idea of describing software the way people realize the real world. The intention is to encapsulate complexity, to hide internal implementation details, to keep software manageable and to reduce the amount of errors. Another positive effect of object orientation is a high degree of flexibility and reusability of software components. Especially algorithms and software related to computer graphics profit from object orientation as graphics elements intuitively map to objects (Fellner 1991). In combination with data flow diagrams object orientation is a very powerful tool that can be seen in numerous visualization applications (see Upson 1989, Chi 2002). The high degree of Java’s portability is achieved by a combination of compilation and interpretation. With a compiler, Java source code is translated into an intermediate language called Java bytecodes – the platform-
independent codes executed by a Java interpreter. With an interpreter, each Java bytecode instruction is parsed and run on any computer with a Java platform. Using this technique Java programs run on Windows, Linux, and Macintosh. Since the programming language Java is established in the field of computer science education and due to its simplicity, high portability and free availability Java is best quality for such a project. 3.2 Java Beans Java Beans is an architecture for the definition and reuse of Java software components. The primary goal is to allow developers to create reusable components in a simple to use and uniform manner. Beans differ from class libraries in that they are intended rather for visual manipulation than for programming issues. AlgoViz takes advantage of this flexibility offered by the Java Bean technology and builds exclusively on beans and visual programming. This purely visual programming approach facilitates an easy handling especially for beginners. As AlgoViz is concerned with the visualization of algorithms in the field of computer graphics and geometric modeling, each single Java Bean implements an element of a computer graphics algorithm. These Java Beans can be composed interactively in a Java Bean container. Such a container is, for example, Sun's BeanBuilder, which allows the visual assembly of an application based on the Java Bean component architecture. The dynamic behavior of an application is specified by "wiring" relationships between different objects of an application. This mechanism is called event handling and works like a message system. The whole interaction between all beans of an application is performed by this event handling.
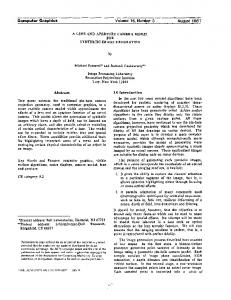
Figure 1: The schematic overview of an example application
A small example shall demonstrate AlgoViz's functionality. The example is a simple application showing the evaluation of a so-called triangle Bezier surface. A schematic overview of its functionality is shown in the Fig. 1.
Of course, all Java Beans can be used in conventionally hand-written Java programs and can be used inside software training, in which the participants can concentrate on the development of the substantial parts of a program instead of rewriting frameworks most the time. Modeled on this diagram the real application consists of five main components: • The AlgoViz Input/Output Panel for points: it allows user interaction. Using this component the user can change the point of view and insert points into a three dimensional space. In this example any viewpoint changes are reported to a component handling projections. • The projection bean: this bean is similar to a camera and consequently it is responsible for the visualization of three-dimensional objects. Its most important part is a projection matrix, on which every two dimensional visualization is based on. • The points inserted into the AlgoViz Input/Output Panel are sent to a component which interprets them as control points of a Bezier surface's control mesh. A Bezier surface is a so-called free-form surface. It is used very often in computer-aided design. As results this bean returns both the control mesh and the generated free-form surface. • In this example the control mesh is sent to a renderer, which generates a wire frame view. • The free-form surface is sent to a renderer, which generates a colored view. Both renderers (the wire frame
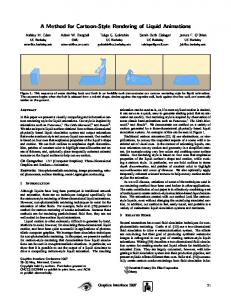
Figure 2: Screenshot of the development environment
renderer and the XYZ-shader) need the projection matrix to create an image that will be blended into the point visualization of the input/output panel. Each of these components is realized as a single Java Bean. Therefore the application reflects this schematic structure, which can be seen (Fig. 2). It has been taken during the creation process and shows three windows. The upper window is the main window. It offers the possibility to load, save and start an application. Furthermore, it is the starting point for each new application. The beans needed to build an application are grouped by themes. Additional groups can be included if needed. In this example the groups "IO", "Render", "Geometry" and "CAGD" are included.
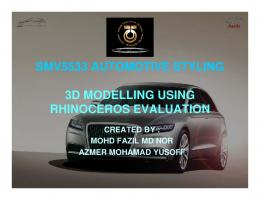
To create a new program, one first selects a bean and places it in the editor window. The editor window is the lower right window in the figure above. This window shows the application's beans and their data flows. As already mentioned, beans communicate among each other using short messages, called events. A new connection between two beans can be established by simply clicking on two data access points, which are the beans' starting points and endpoints for events. Upon completion, a connection wizard (Fig. 3) will show the possible connections between these two beans. To transfer the points from the input/output panel (source) to the Bezier bean (target) one would simply choose the source method "getPoints" in combination with the target method "setPoints". Having selected the desired connection type, the wizard creates the event-based connection.
Figure 3: The connection wizard
But this is not the only task of the editor window. Switching from event management into layout management the application's layout and look can be determined via drag and drop. Last but not least, Figure 2 shows the property inspector. This window shows all beans in a tree view and their properties. In this example the point panel – an input/output bean – is selected and one could now edit its properties.
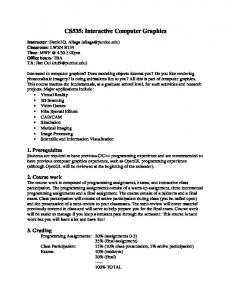
Figure 4: A Java XML Applet
Another feature, which simplifies the development of new programs, is the flexibility during the creation process. The Bean Builder can start the application during the creation process. Although the program is already running one can modify its properties and the result of these changes can be seen at once. Once the application is completed and stored in an XML file, there are several ways to execute it. The first option is to use the BeanBuilder with which the application has been built. A second option to start the application is to use a Java XML interpreter. It is preferable to choose the second one, if the development environment shall not be started at the same time. Another possibility is to use a Java XML Applet that is capable to interpret the XML file. Figure 4 shows a Java XML Applet. All it needs to execute a Java XML application is its Internet address. Consequently, this is the preferred way to publish an AlgoViz application. Just put its XML file on a server.
4
Range of Applications
The flexibility of the building block system opens AlgoViz a wide range of applications: As completed modules can be posted on the internet and executed like a simple applet a normal student will not recognize any differences to an ordinary applet. But in contrast to an ordinary applet, every user can download the XML file and explore or modify it. Revealing its internal structure is one of AlgoViz's strengths. Moreover, it offers easy access to an algorithm due to its top down approach: • On the first level there's the whole application. • Looking inside its XML file, the second level can be seen. The whole application consists of several separate components, each one realized as a single Java Bean. • Having a look into a single Java Bean, one can explore an algorithm on its lowest level – line per line in its source code. This procedure is adequate for blended learning scenarios or for the enrichment of a traditional lecture. However, AlgoViz can also be utilized in a totally different context. A less pleasing but inevitable job during software training is the implementation of the embedding frameworks for the algorithms in focus. Moreover, in many cases the framework takes most of the time. Using a uniform framework as provided by AlgoViz, the participants of a software training can concentrate on the development of the substantial parts of a program instead of rewriting frameworks.
5
First Results and Future Work
Besides the Beans mentioned above AlgoViz already offers a toolkit to visualize algorithms from several domains. The first set of Beans addresses color spaces. The Beans support user interaction for choosing a color and offer the most important color conversion algorithms. Figure 5 shows a more complex example combining several Beans related to colors and color conversion. This application demonstrates how to convert a color, which is given e.g. as an RGB triple into HSV or CIE space and vice versa. Having solved the technical problems that arose during the implementation of the first set of Beans, the next topic addresses was about Digital Differential Analyzers. These Beans visualize a technique that is used to display a continuous function in a discrete raster representation. In the meanwhile more topics have been addressed and many fundamental computer graphics algorithms are now supported by AlgoViz. Of course, completing the set of commonly accepted basic algorithms is one future task that has to be performed. At the same time two other main tasks will be addressed. Currently we are working on the didactical presentation and publication via the Internet. The current status can be tracked at the AlgoViz Project website: http://XXXXXXXXXXXXXXXXXXXXXXXXX As soon as this step is completed, AlgoViz will be made available to the community via CGEMS – Computer Graphics Educational Materials Source (http://cgems.inesc.pt) – a site designed for educators to provide a source of refereed high-quality content as a service to the Computer Graphics community as a whole. Second, we will enhance the AlgoViz visualization abilities with a new visual inspector, which will disclose and unfold internal details of a Java Bean using techniques that come into operation in the field of software debugging.
Figure 5: A demo for color diagrams created with AlgoViz
6
Summary
AlgoViz is a software environment, which enriches computer graphics teaching. Due to its building block system it offers a very flexible environment for lecturers who want to visualize algorithms efficiently and who do not have the time to program everything from bottom up. The created applications can substantially enrich a lecture. Furthermore, the visualizations can be published rather effortlessly via the Internet using an XML file format. In contrast to simple Java Applets each application created with AlgoViz always offers the possibility to be downloaded and analyzed. This feature is very interesting for students familiarizing themselves with the internal structure of an algorithm. In the near future AlgoViz will cover all important, fundamental computer graphics algorithms and will be available as a framework for visualization issues in computer graphics education.
Acknowledgements We would like to thank Sun Microsystems, Inc. for their support on Java BeanBuilder. Support by the eLearning Academic Network Niedersachsen ( http://www.elan-niedersachsen.de ) is gratefully acknowledged.
References Brown University Computer Graphics Research Group (2002). The Exploratories Project. http://www.cs.brown.edu/exploratories/home.html Ed H. Chi, Palo Alto Research Center (2002). Expressiveness of the Data Flow and Data State Models in Visualization Systems. In Proc. of the Advanced Visual Interfaces Conference, pp. 375--378. ACM Press, May 2002, Trento, Italy. U. Drofenik, J.W. Kolar, P.J. Van Duijsen, P. Bauer (2001). New Web-Based Interactive E-Learning in Power Electronics and Electrical Machines. Conference Record of the 2001 IEEE Industry Applications Conference 36th IAS Annual Meeting, Chicago (Illinois), USA, (3) 1858-1865. D. W. Fellner (1991). Object-Oriented Programming – Does it Help in Computer Graphics?. In Maurer H.: New Results and Trends in Computer Science. Lecture Notes in Computer Sciecne 555. Springer Berlin (1991), 132-151. F. C. Figueiredo, D. E. Eber, J. A. Jorge (2003). A Refereed Server for Educational CG Content. The annual conference of the European Association for Computer Graphics (Eurographics 2003), University of Granada, Granada, Spain. D. Flanagan (2002). Java in a Nutshell, Fourth Edition. Sebastopol: O'Reilly & Associates. F. C. Figueiredo, D. E. Eber, J. A. Jorge (2003). CGEMS - Computer Graphics Educational Materials Server. The 30TH International Conference on Computer Graphics and Interactive Techniques (SIGGRAPH 03), San Diego, California, USA. R. Klein, F. Hanisch, and W. Straßer (1998). Web based Teaching of Computer Graphics: Concepts and Realization of an Interactive Online Course. In SIGGRAPH 98 Conference Proceedings, Addison Wesley, 1998. http://www.gris.uni-tuebingen.de/projects/grdev/doc/html/Overview.html M. Kilian, T. Mohs, R. Straub, C. Bangert und H. Prautzsch (1997). CAGD-Applets -- an interactive tutorial on geometric modeling. http://i33www.ira.uka.de/applets/ J. R. Laleuf, A. M. Spalter (2001). Create@BROWN, A Component Repository for Learning Objects: A Progress Report. Proceedings of ACM JCDL 2001. B. McLaughlin (2001) . Java & XML: Solutions to Real-World Problems. Sebastopol: O'Reilly & Associates P. Min (1999, 2002). Computer Graphics Applets. http://www.cs.princeton.edu/~min/cs426/applets.html W. Strasser, S. Gumhold, F. Hanisch, M. Hauth, A. Ehlert (2001). Spielend Visualisieren. http://www.gris.uni-tuebingen.de/projects/vis/titlepage.html Sun Microsystems, Inc. (2002). The BeanBuilder. http://java.sun.com/products/javabeans/beanbuilder/ C. Upson, T. Faulhaber, D. Kamins, D. Laidlaw D. Schlegel, J. Vroom, R. Gurwitz, and A. van Dam (1989). The application visualization system: A computational environment for scientific visualization. IEEE Computer Graphics & Applications, 9(4):30--42, July 1989.