263. Modeling to Support Reliability Enhancement. During Product Development With Applications in the U.K. Aerospace Industry. Lesley Walls, John Quigley, ...
IEEE TRANSACTIONS ON ENGINEERING MANAGEMENT, VOL. 53, NO. 2, MAY 2006
263
Modeling to Support Reliability Enhancement During Product Development With Applications in the U.K. Aerospace Industry Lesley Walls, John Quigley, and Jane Marshall
Abstract—Reliability improvement is the conceptual norm but has not been achieved by all sectors of industry. The U.K. aerospace industry is one that has aspired to make the transition from a culture of reliability demonstration to enhancement. This paper presents action research that examines the challenges facing this industry. A statistical model is developed to help measure the likely impact of failure modes on operational performance, hence providing a basis for managing the enhancement process. The model, which has general applicability to other product development processes, is stated and justified. The industrial interventions are described and an analysis of findings is presented. The proposed model is better than traditional approaches because it provides a systematic process to capture and integrate data from different sources to estimate reliability by directly measuring the engineering improvement achieved through product design and development. The estimates can be used to inform a traceable coherent argument about the level and growth in reliability to management and the customer as well as to provide insight into the impact of alternative engineering modifications to the design team. The modeling process has contributed to the partial transition to reliability enhancement of a consortium of companies who have changed their standard operating procedures to reflect the lessons learned from the research intervention. The insights gained contribute to an understanding of how the U.K. aerospace industry is changing its management of reliability enhancement in design. Index Terms—Bayesian model, expert judgment, product development process, reliability enhancement, reliability in design.
I. INTRODUCTION
R
ELIABILITY is a key product attribute because failure of products to function can be costly and lead to unsafe operating conditions [1]. The standard definition “the ability of a product to perform a required function under stated conditions for a stated period of time” [2] translates into a probability measure supported by models such as fault trees and reliability block diagrams [3]. Some challenge this definition. For example, the authors of [4] emphasize that the product’s encountered, rather than specified, use conditions are critical. Reference [5] believes
Manuscript received November 1, 2003; revised August 1, 2004, December 1, 2004, June 1, 2005, and July 1, 2005. Review of this manuscript was arranged by Department Editor A. Marucheck. This work was supported in part by the U.K. DTI and by the aerospace companies who provided support for the REMM Project. L. Walls and J. Quigley are with the Department of Management Science, University of Strathclyde, Glasgow G1 1QE, U.K. (e-mail: lesley@mansci. strath.ac.uk). J. Marshall is with the Warwick Manufacturing Group, University of Warwick, Coventry CV4 7AL, U.K. Digital Object Identifier 10.1109/TEM.2006.872342
“reliability is quality over time,” implying that good quality is necessary, but not sufficient, for reliability since the latter can only be properly assessed after a product is in use. The authors of [6] advocate a more useful definition, due to [7], “reliability is failure mode avoidance” because it supports analysis aimed at improving reliability through development rather than predicting reliability after the engineering is complete. The latter definitions are consistent with a design for reliability culture [8], where important failure modes are identified and eliminated as early as possible. Many failure modes, usually controllable factors related to product strength, can be anticipated through engineering knowledge, while failure modes due to lack of product robustness to variation in combined operating stresses can be identified through test. An extensive literature exists concerning identification of failure modes [3], [9] and the role of probabilistic methods in design and test to support assessment of design margins given strength–stress variations [6], [10], [11]. While eliminating failure modes causes reliability improvement, measuring reliability supports management decisions regarding, for example, resource allocation and product release. It is not sufficient to rely on failure mode lists prioritized by a method, such as the risk priority number [12], since these lack information about the time until failure realization. Similarly, conventional estimates from demonstration tests are not useful because the data gathered are usually incomplete and generated too late in the product development process to inform decisions [4], [13]. Today, reliability enhancement is the accepted norm [14]. Many industry sectors have embarked on the journey from reliability demonstration to improvement in the wake of the quality movement, for example, automotive engineering [6] and consumer electronics [15], with the transition rate depending on factors such as demand of the market, duration of product life, and degree of technology innovation. The U.K. aerospace industry represents one sector in which there are major changes in the manner reliability is being assessed. Large companies assume the role of systems integrators, with the design and manufacture of subsystems being outsourced to a chain of suppliers [16]. The systems integrator, as prime contractor, has responsibility for meeting customer requirements. Both civil and military customers have moved toward a progressive reliability assurance framework embedded within service level contractual agreements, such as “power by the hour” contracts in the civil market [17], evolutionary acquisition in U.S. defense [18], and progressive assurance by the
0018-9391/$20.00 © 2006 IEEE
264
IEEE TRANSACTIONS ON ENGINEERING MANAGEMENT, VOL. 53, NO. 2, MAY 2006
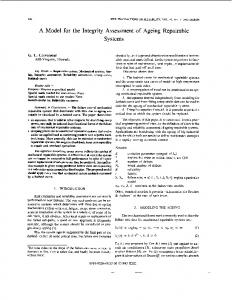
Fig. 1. Uncertainty in reliability profile through product lifecycle.
U.K. Ministry of Defence [19], [20]. By contracting for operational availability, such contracts offer suppliers incentives to enhance reliability since high maintenance costs will erode earnings, and poor availability can incur financial penalties. This change in business environment impacts the manner in which suppliers need to measure and manage reliability since many of their processes are aligned with the previous prescriptive approach where reliability was demonstrated through agreed tasks in a customer defined reliability program. Fig. 1 conceptualizes how reliability might evolve through the product lifecycle under progressive assurance. The reliability indicator is not specified, but it is assumed that higher values are better, such as probability of successful operation or mean time between failure (MTBF). Usually, the supplier is risk averse, setting a target exceeding customer requirements to provide a buffer for uncertainties. While the expectation is reliability growth, there is no guarantee of a monotonic improvement. Fig. 1 shows a decrease during early detailed design in anticipation of additional concerns as the conceptual design is articulated in detail. Fig. 1 also shows uncertainty bands around estimated reliability. These are expected to be wider in early life but narrow as more information about reliability risks are identified, understood, and controlled. To properly measure reliability enhancement requires a model capable both of integrating data arising from engineering analysis and development test, and of supporting indicators meaningful to engineering management to inform decision making. It is acknowledged that methods for integrating different sources and types of reliability data require research [4] and that measuring reliability is difficult because it is an artifact of life performance rather than an observable or physical phenomenon [3]. Drawing upon the conceptual profile in Fig. 1, and given the corollary with continuous improvement, we propose to develop a learning curve [21] model. Using learning curves is not new since they underpin classes of statistical growth models used to analyze failure time data from development test [22], [23]. Such models have informed our thinking, but we have sought to relax unrealistic assumptions made for mathematical tractability [24] and extend the model to design when no failure observations are available. The proposed model contrasts with the traditional system reliability models, such as fault trees and reliability block diagrams, which aim to estimate system reliability as a function of the logic relating the component parts. We do not pursue this type of model for several reasons: detailed part data
may not be available in early design, simplifying assumptions (e.g., Markovian property) may not be valid, reliability indicators (e.g., constant failure rate or MTBF) supported have limited meaning, no formal updating mechanism exists, and systemic effects may be lost due to the decompositional nature of analysis. Using Bayesian inference with system models has been proposed to provide better data integration and updating [25]. Recently, applications of such approaches have been reported in automotive and defense industries [26], [27]. While mathematically sound and reportedly useful in their development contexts, such models are not sufficient for the problem facing aerospace because the learning curve implicit in enhancement is not modeled explicitly and the parameters within system models for which uncertainties are to be quantified are abstract since they are divorced from the engineering design process. In summary, we seek to answer the research question “How can a statistical modeling process be developed to measure reliability enhancement to support engineering management decisions and to provide progressive assurance to the customer?” To answer this question, we seek to demonstrate the following. 1) A statistical model can be developed to estimate meaningful measures of reliability during product design and development using data from engineering enhancement activities and providing management with an estimate of the uncertainty in reliability so that the growth profile can be assessed against the target to inform on decisions. 2) The statistical model can be used in practice by the U.K. aerospace industry to support reliability enhancement activities as well as provide assurance to customers. The goal of the first proposition is to show that a statistical model can be developed to provide a theoretical process, which has general applicability. The goal of the second proposition is to show that the theoretical model can be operationalized and impact upon the way a class of organizations manage reliability. Section II describes the action research methodology employed. Section III defines the problem from the perspective of U.K. aerospace stakeholders leading to requirements for the model and criteria against which it is to be evaluated. Section IV describes the theoretical modeling process, while Section V summarizes industrial interventions and describes two projects in detail. Section VI analyzes the outcomes of the research and suggests further work. II. ACTION RESEARCH METHODOLOGY Action research [28] is the chosen methodology because the modeling theory developed is grounded in a management problem and the evaluation of model implementation will be based on data generated from real projects influenced by organizational interventions. We attempt to address the common criticisms of action research [29]—namely generalizeability, lack of environmental control, and researcher bias—through appropriate selection of projects in multiple organizations and continuous collection of data, both objective and subjective. A. Organization and Project Selection The researchers approached major U.K. aerospace companies active in the reliability community and affected by the changing
WALLS et al.: MODELING TO SUPPORT RELIABILITY ENHANCEMENT DURING PRODUCT DEVELOPMENT
business environment. A consortium has been formed to define the nature of the problems facing suppliers and to evaluate potential solutions. Funding has been sought and provided by the U.K. Department of Trade and Industry, in conjunction with the industrial consortium, for a project labeled Reliability Enhancement Methodology and Modeling (REMM). There have been two phases of research. The first (1998–2001) involved Goodrich Engine Controls, BAE Systems, Fr-HiTEMP, and Smiths Industries and focused upon problem structuring and, for the researchers, specification of model theory. The second (2001–2004) involved the original companies plus Rolls Royce and Agusta Westland for the model implementation and evaluation. Hence, the consortium covers the first three levels in the aerospace supply chain [30]. To maximize generality of findings, a number of factors have been identified to control the selection of projects for model implementation. These are: customer type (e.g., civil or military), since this relates to the business drivers and approach to assurance of reliability; product characteristics (e.g., item description, type of aircraft on which item installed, technology type and innovation), since these relate to the nature and degree of change within the engineering enhancement process; and design process (e.g., organization structure with respect to reliability, size of project team, lifecycle stage), since this relates to the way in which reliability is managed within the organization. Due to opportunity constraints, the combinations of characteristics selected cannot be subject to full experimental control. A summary of the projects actually selected is given in Section IV. These projects are considered a representative cross section of the industry. B. Data Collection for Problem Structuring and Evaluation Similar methods have been used to gather data from stakeholders in both research phases. Reliability managers, engineers, and analysts are common throughout, while project managers, lead engineers, members of the design team, and other engineering specialists make a major contribution to the implementation and evaluation phase. Data collection methods are individual interviews, both semistructured and unstructured, group discussions and facilitated workshops, engineering reports, informal conversations, and researchers personal observations. The latter provide useful data about cross-company comparisons, hunches about relationships, anecdotes, and informal observations on company willingness and ability to change. The collation of observations from multiple stakeholders employing multiple data collection techniques and obtaining stakeholder verification of records from formal data collection allow findings to be triangulated and the risk of researcher bias to be minimized [31]. III. PROBLEM FROM PERSPECTIVE OF AEROSPACE STAKEHOLDERS At the outset of the research, industry perceived the legacy of the prescriptive approach prevailed, meaning suppliers divorced reliability measurement from the engineering improvement process. Consequently, the reliability program contained activities which were the contractual norm, rather than because
265
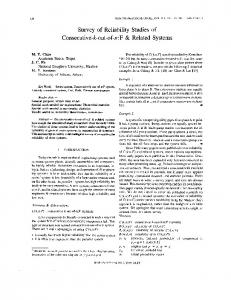
Fig. 2. Reliability enhancement modeling process.
they added value, and a low level of integration existed between activities, data, and findings of analysis. The industry believed the primary problem was how to produce an auditable coherent argument about the estimated product reliability using evidence from the engineering enhancement process to the customer. A secondary problem was how to assess the effectiveness of activities to inform the reliability program. Fig. 2 presents the process envisaged to address these problems. Customer requirements, which are translated into meaningful targets, specify the form of the reliability indicator required. During design, it is natural to examine data from related product families. Such data should be exploited to support engineering analysis of potential failure modes as well as to provide relevant operational data to develop reliability profiles of times to failure. A statistical model with supporting inference is required to generate formal reliability estimates, including uncertainty. These estimates can be assessed relative to target to form an “evidence cycle.” The model should also support a “planning cycle” by measuring the anticipated impact of reliability activities and design modifications through sensitivity analysis to support the reliability program. As observations arise from activities, the model should be updated, with revised estimates being assessed against targets repeating the evidence cycle. A transition from emphasis on judgmental and secondary data in early design to primary observations during development is expected. This process defines the needs of the model and leads to the identification of natural criteria upon which to evaluate the model. These include ease of implementation, validity of assumptions, value of data, credibility of estimates, quantification of uncertainty, and impact on engineering management processes. IV. THEORETICAL STATISTICAL MODEL FOR RELIABILITY ENHANCEMENT To address the industrial problem structured, a statistical modeling process is designed, drawing upon the theory of stochastic modeling, Bayesian inference, and scientific data collection. A. Assumptions and Definitions 1) An item contains a fixed, but unknown, number of failure modes.
266
IEEE TRANSACTIONS ON ENGINEERING MANAGEMENT, VOL. 53, NO. 2, MAY 2006
2) The number of failure modes can be estimated using structured engineering judgment, where each potential failure mode is known as an engineering concern. 3) The set of actual failure modes within the item is a subset of the collection of engineering concerns about the item. 4) Failure of the item occurs when the first of the failure modes is realized in operation. 5) Given a failure mode exists, the time to realize this failure mode as a failure event can be estimated using historical data from similar product designs. 6) The times of failure mode realizations are statistically independent, conditional upon the operating stresses. Assumption 1 is not unreasonable given our view that unreliability is correlated with the existence of failure modes. Assumptions 2 and 3 follow naturally in that a controlled process is required to obtain an estimate of the number of failure modes but acknowledges epistemic uncertainty may exist in that estimate. A concern may or may not be a failure mode, given that true failure modes are not known prior to the item failing in operation, but concerns can be articulated during design. Assumption 4 acknowledges that different failure modes are competing to fail the item, but that the time to the first failure event regardless of the mode is of primary importance. Assumption 5 implies that the operating stresses experienced by earlier generations of the item are representative of the future operating conditions of the new design. To accommodate variation in stresses, we propose to create subsets of historical event records for each concern, labeled as failure classes. Each class is considered representative of the possible realization times of the associated concern assuming it were a failure mode. Since more than one failure mode can have similar failure time patterns, we permit mapping more than one concern onto the same failure class. Assumption 6 implies that if the operational stresses an item will experience are known, then knowledge about the time at which one failure mode will be realized provides no further information about when another failure mode will be realized. The major implication of this assumption is that the rate of failure mode realization will depend upon operational stresses, but common mode failures due to other causes are not considered significant reliability drivers. While more complex competing failure mode models have been proposed, theoretical identifiability problems have been reported [32] and practical data are not available in this context to support parameter estimation. Therefore, this assumption should be validated during the elicitation process through appropriate definition of engineering concern. B. Stochastic Model Let denote the probability that a failure mode, realized as a failure in class , can remain undetected within an item for failure at least operating hours. Assuming that there are modes associated with class , then the probability that an item will operate without failure for hours is
(1)
The reliability function (1) is conditional because it assumes the number of failure modes for each class is known. An elicitation process is required to obtain a subjective probability distribution that measures the likelihood of there being any number of failure modes for each class. Denoting the subjective probability of there being failure modes associated with class by , the unconditional reliability function is then obtained by calculating the expectation of (1) with respect to the subjective probability distribution
(2)
The function (2) forms the basis for the model. Summary measures based on percentiles, for example, median time to failure, can be obtained by inverting this function, while mean time to failure can be obtained by integrating this function; although, this may require numerical methods. C. Elicitation of Subjective Distribution for Number of Failure Modes A semistructured method has been developed to elicit the subjective distribution . The approach has been informed by the Stanford Research Institute’s process for managing potential biases [33], [34]; Kelly’s theory of personal constructs [35] provides a theoretical framework for the cognitive organization of expert experiences and methods for subjective probability assessment [36]. A detailed account of our method and its relationship to the range of literature is described in [37] and [38]. Here, we summarize the five key stages, each of which will be managed by a facilitator, knowledgeable in the elicitation process and the product design. Stage 1—Selection of Experts: Identify experts with depth of expertise and breadth of experience representing all appropriate domains of knowledge (for example, system design, component, technology, materials, test, manufacture, operation, and maintenance engineers). Stage 2—Briefing Experts: Introduce the process—its purpose, methods, and use of results—to participating experts with view of gaining their commitment and train them to ensure they are able to provide probabilities by making the process transparent. Stage 3—Eliciting Engineering Concerns: Conduct elicitation through a sequence of semistructured interviews with individual engineering experts to build up a map of potential faults, their root causes and failure modes, classification, and chance of occurrence following a standard protocol, but allowing free communication. An example map is shown in Fig. 3 and is developed by focusing on a suitable partition of the design, for example, changes from an earlier generation, and exploring the concerns arising from that change by asking experts to explain what elements of the design they would invest in if given
WALLS et al.: MODELING TO SUPPORT RELIABILITY ENHANCEMENT DURING PRODUCT DEVELOPMENT
267
Fig. 3. Example generic concern map to identify potential failure modes.
more resource. This should provide an effective means of eliciting concerns about potential failure modes within the design without loss of face to the engineers who are naturally reluctant to declare shortcomings. The concerns surfaced are discussed to understand their causes and implications, and the subjective probability of their occurrence as failures in operation is assessed conditional on the current state of the design. Stage 4—Verifying Design Concerns: Correlations between experts can exist since the subjective assessment of each is conditioned on the same design and there will be shared experiences. Potentially correlated experts are brought together in groups to reconcile differences, confirm disagreements, and avoid double counting. The reasons for scheduling group sessions after individual interviews is that we seek to minimize the influence of strong personalities and working with individuals provides more control over the verification and validation of the subjective probabilities. The conditional independence assumption, assumption 6), can be assessed during verification. If existence of a concern as a failure mode were to provide information as to the existence of another failure mode, then the concerns should be redefined into three elements, one consisting of the common element to both concerns and the other two being the original concerns but excluding the common element. This is discussed in [39]. Stage 5—Aggregation: The probabilities for each agreed concern are convoluted by class to provide the distribution denoted by . D. Construction of Reliability Function Using Operational Event Data The other input is a probability distribution measuring the time a failure mode will be realized, given it exists. For this, we propose to use operational data concerning event histories for related designs operating under similar environments. Constructing such a conditional probability distribution is not straightforward since operational data can be incomplete and subject to multiple censoring. Further complications arise when pedigree designs are modified in use with corrective action
being rolled out across a fleet and evidenced by reliability growth in operation. A thorough investigation of relevant database records is required so that data on irrelevant failure modes is not used and the presence of modifications is identified. Standard parametric or nonparametric techniques [9] can be employed to construct suitable probability distributions that represent the probability of failure for the similar design. E. Inference for Model Parameters Interval estimates for the reliability function of the new design can be derived by obtaining appropriate upper and lower bounds on the reliability function (1), which is conditioned on the number of failure modes , and then by evaluating the expectation of the upper and lower bounds with respect to the prior distribution describing the number of failure modes. The choice of method for obtaining upper and lower bounds on the conditional distribution is one for the modeler; however, for a detailed evaluation of implementing a Bootstrap solution for this problem see [40]. F. Model Updating Two approaches are proposed for updating model estimates in the light of observations from reliability activities: re-eliciting the subjective probability distributions from engineers who are given feedback from activities or using a Bayesian updating scheme. Differences in the resulting inference between the two approaches may result if model formulation is poor or cognitive biases exist with the expert judgment. Therefore, a comparison of updates through each approach supports model validation. Bayesian updating can be conducted using observed data from engineering analysis or test if, a priori, the likelihood that an activity will expose a failure mode assuming it exists within the design is also elicited from experts. This probability can be assessed during the individual interviews; although, the natural source of these data may not be the expert who identified the concern since s/he may not possess the requisite knowledge to assess the efficacy of a particular activity in exposing weaknesses. Hence, group sessions will be important in reviewing these probabilities.
268
IEEE TRANSACTIONS ON ENGINEERING MANAGEMENT, VOL. 53, NO. 2, MAY 2006
TABLE I PROJECT INTERVENTIONS ACROSS U.K. AEROSPACE ORGANIZATIONS
Let denote the subjective probability that concern may denote the probability that be realized as a failure, and let activity will expose concern as a failure mode, given it exists. If the th concern is exposed as a failure mode during an activity, then the updating probability that it exists is one. However, if the concern is not exposed during an activity, it may be because the failure mode does not exist or because of the efficacy of the test. Hence, the Bayesian updated probability that concern may be realized as a failure given the outcome of activity is given by if failure mode not exposed if failure mode exposed Updating is the key to measuring the impact of enhancement activities in terms of level and uncertainty in reliability estimates. V. INDUSTRIAL INTERVENTIONS Table I shows the characteristics of the projects selected against the attributes proposed in Section III. For several projects (2, 5) it has been feasible to monitor multiple stages, but for others (1, 3, 4) only single interventions have been possible due to resource and time constraints. The most common measures supported have been MTBF (1, 2, 5) and the reliability function (3). Both parametric (2, 5) and nonparametric (1, 3) reliability have been estimated, all (except project 5) using relevant operational data for the product family. For project 5, the design novelty meant no relevant operational data was available; hence, experts also provided an assessment of the subjective probability distribution of times to realization. To illustrate model instantiation, we examine two interventions (projects 3 and 5) that represent the two contrasting projects from organizations not involved in problem structuring and hence independent of the model proposed in Section IV.
A. Project 3—Agusta Westland Intervention for Upgrade of Mechanical Item The project selected is typical in that it represents an evolutionary upgrade of an existing design but is a risk averse choice in that the new design is in its detailed phase with the model implemented in parallel with existing standard operating procedures. A company reliability specialist facilitated communication between the researchers and the design team. The engineers want to understand the chance of the item working without failure until a major overhaul. The operational time to realization of potential failure modes is measured in terms of aircraft flying hours since this was considered most representative of exposure to operational stress given the usage profile of the item. Since the probability of successful operation is required, the model is represented by the basic reliability function given in (2). The company possessed a well-developed service failure taxonomy, which was used to define failure modes classes. The process to elicit potential failure modes involved six members of the design team with expertise in mechanical design, technology, materials, stresses, and test regimes, covering appropriate, but not exhaustive, knowledge domains. All engineers were internal to the company. The lack of operators or maintainers means possible failure modes may be overlooked, but given this model is a first pass at company level, this lack of user input was not considered a major limitation since data about operational experience is available through routine reporting mechanisms. The briefing session was important in ensuring buy-in from both the engineers and their project manager. Individual interviews, each lasting one to two hours, were held over two days with all engineers engaging in the construction of maps facilitated by a researcher. In postinterviews, the researchers combined the results across engineers, first in simple tables and second through convolution of the failure probabilities per class into prior distributions.
WALLS et al.: MODELING TO SUPPORT RELIABILITY ENHANCEMENT DURING PRODUCT DEVELOPMENT
269
TABLE II DESENSITIZED SAMPLE CONCERNS
Table II shows a desensitized example. The change driving the failure mode is noted as well as the class allocated. The reference number represents the “engineer.concern” to trace data to the original maps. The likelihood represents the engineer’s subjective probability that a potential failure mode will exist in operation, assuming no action is taken to remove or mitigate. When several probabilities are presented per concern, these represent the views of different engineers. A group workshop was held within a week of interviews to explore potential correlations between failure modes and to clarify differences between subjective probabilities. After describing findings from individual interviews to verify records and to frame subsequent discussion, each concern was explored to examine the modes and causes from different perspective and agree classification. Not surprisingly, given the late stage of design, a consensus was reached quickly. However, reconciling different subjective probabilities values was not so straightforward because opposing views were held about the likelihood of some concerns. The outcome of the group session was an agreement about the baseline probabilities, as shown in the final column of Table II and to note uncertainty in values and views to inform sensitivity analysis. The tables provided immediate feedback to the design team, although the prior distribution of the number of concerns generated from these data, as shown in Fig. 4(a), represents the model input. The prior distribution was verified by the reliability specialist to assess its credibility in terms of the variation in the number of failure modes anticipated. Records of operational events experienced by the earlier generation of this design had been part processed by the reliability specialist. This minimized search and processing tasks. Some data preparation was required, for example, to explore anomalies such as missing flying hours, which could be interpolated from contiguous events for the aircraft, and to agree an appropriate censoring structure. Once completed, the data were analyzed using standard Kaplan-Meier reliability functions [41]. Fig. 4(b) shows selected functions for three failure classes, A–C. These indicate that for the existing product, class A has poorest reliability, dropping rapidly as operational exposure increases, compared with B and C. This suggests that designing out class A failures should be a priority since it would lead to greatest improvement in reliability. The estimate of the upgraded design is obtained by the statistical model, which adjusts the operational reliability profiles for each class using the corresponding subjective prior probability distributions, and is given by the reliability function, which is as an approximation to equation (2)
Fig. 4. (a) Prior distribution for number of concerns. (b) Estimated nonparametric reliability functions for previous generation of product. (c) Estimated reliability functions for new design.
where represents the empirical nonparametric reliability function for the three classes. is shown as the solid line in Fig. 4(c). The model has been rerun under a number of scenarios. The impact of uncertainties in subjective probabilities is found to be relatively low. Discussions with the reliability specialist identified downstream development activities and investigated their impact on reliability. Not surprisingly, these dampen the chance of certain failure modes resulting in an increased reliability over the operational horizon considered as shown by the broken line
270
IEEE TRANSACTIONS ON ENGINEERING MANAGEMENT, VOL. 53, NO. 2, MAY 2006
in Fig. 4(c). A report documenting data inputs, model scenarios, and results was used by both the reliability specialist and the design team to assess findings in relation to the specified overhaul time. After the intervention, data about the value of the model were collected. Generally, the model is valued, with the belief that the process “is expected to provide significant improvements in the ability of the company to identify worthwhile design changes during modification activities” and “will allow a better evaluation of the impact of modifications.” However, “early fears about the time required to undertake the process were unfounded and all involved felt the time to be well spent.” New project bids include reference to intended use of the modeling process, which is also to be implemented in anger on current projects, where contractual agreements allow. We believe there are two main reasons for this conclusion. First, the model fills a gap in company processes; second, elements of the model provide improved means of executing existing tasks. For example, elicitation was considered a more systematic means of gathering views of the design team with timely and useful feedback: “ general consensus amongst engineers that the individual interviews allowed greater opportunity for expression of personal opinions than is possible in the conventional design review process” and that “use of the elicitation process is seen as a very powerful tool to identify real concerns during the design phase and if used early enough it is believed that that the technique will help reduce the overall design effort.” The model is also related to conventional failure time analysis, such as Weibull [3], and hence represents an extension of current approaches. Outputs are understood and credible to engineers, both design and reliability, with the link between statistical measures and engineering understanding of design reliability being bridged: “use of the detailed statistical modeling gave a greater degree of confidence to the design team that they were addressing the correct issues and that the design solution was likely to improve reliability.” This intervention worked smoothly because it involved a small team which was designing an understood technology. However, a limitation of this project was the lack of opportunity to formally update the model in light of the development test. B. Project 5—Rolls Royce Intervention for Novel Electronic Item Rolls Royce has been developing an engine monitoring unit which utilizes a design architecture with new electronic technology and requires early reliability estimates to inform the development program as well as to meet customer needs for evidence about the efficacy of proposed reliability enhancement testing (RET). RET aims to highlight design faults caused by vibration, thermal cycling, and humidity exposure. The intention is to take the item beyond its certification limits until it breaks, surfacing potential problems, which may occur later in the life. Design modifications are conducted as a result of the test to eliminate the major concerns before entry into service. Initially, the company used MIL-HDBK-217 analysis [42]. This involved determining part reliabilities from this generic database, asking engineers about their uncertainties in these estimates, expressed as a percentage error in the point estimate, and
propagating uncertainties through the system reliability block diagram. The resulting system estimate matched requirements but with wide uncertainty bands. The estimates were considered indefensible because assumptions were made about part operating stresses and because engineers anchored upon common percentage errors. Therefore, this was regarded as an appropriate project, albeit already in development, to examine use of the modeling process. Since this product has no heritage within the company, all model inputs are assessed subjectively. Further, since implementation is on the critical path, the company wishes to control data collection. To customize the model to deal with these constraints, only conjugate priors are considered. The distribution of time to realize each failure mode and the prior distribution describing the epistemic uncertainty in the scale parameter are both assumed to be Gamma distributed and are given, respectively, by
and
Combining these to obtain the predictive distribution gives the following Beta distribution:
Elicitation requires extension to obtain the subjective distributions of time to realization. The established fractile method [43] is used where each expert is asked to assume a fleet of 100 items from which the time by which a specified percentage (50, 5, 95, 25, 75) are expected to be working. The parametric Beta distribution is fitted to the elicited distribution to smooth data. Real-time checks are made by the facilitator to assess validity visually by comparing subjective and fitted distributions and numerically by computing bias and error statistics. Only if good fits are established is the distribution accepted. Elicitation is further extended by including questions about the judged efficacy of RET, since this will support a comparison of the perceived and observed effects. The preferred reliability indicator was MTBF, for which there was no closed form solution with this model and required numerical integration methods. Modeling was conducted twice—before and after RET. Project personnel with responsibility for reliability facilitated elicitation. Different facilitators on the pre- and post-RET interventions necessitated by staff changes, but researchers
WALLS et al.: MODELING TO SUPPORT RELIABILITY ENHANCEMENT DURING PRODUCT DEVELOPMENT
271
TABLE III DESENSITIZED MODEL RESULTS FOR PROJECT 5
conducted test runs with each before implementation to use to ensure consistency. A common interview pack was developed comprising photographs, drawings, classes, and examples to stimulate engineers thinking about potential failure modes, enhance understanding of layout, and construction of the item and train in probability assessment. Requisite domains of knowledge are identified relating to functionality, parts, technology, manufacture, and use, with at least one engineer selected per domain. Eight engineers, including one from a supplier, provided data. Briefing was conducted at the outset of the interviews with emphasis placed on the need for honesty since the process aims to capture genuine beliefs and uncertainties and is not aimed at testing knowledge per se. The individual interviews followed the appropriate variant of the above process pre- and post-RET. Although the fit of the assumed distribution was never perfect, it was considered acceptable in all cases, largely due to the flexibility of the model parameterization. No group session was conducted since it was not considered to add value; instead, the facilitator reviewed all concerns to identify overlaps between engineers and to define scenarios for sensitivity analysis. Table III summarizes results for best and worst case scenarios. Surprisingly, post-RET are worse than pre-RET estimates, although uncertainty has been reduced. Although not shown, the predicted post-RET estimates are consistent with expectations. The predicted change in the MBTF was computed using the post-RET database to examine the anticipated impact of future modifications. A predicted MTBF of 60, relative to a requirement of 100, indicates additional reliability improvement is needed pre-entry into service if the contractual level is to be achieved. Observations about the occurrence or concerns during RET have been collected, allowing Bayesian updates to be generated. Like the updates based on re-elicitation of subjective probabilities as discussed, the MTBF decreases. A statistical test to compare the observed number of concerns realized on RET with the assumed number, under a null Poisson model, indicates that both updates are consistent at a 1% significance level. Evaluating the results, the company investigated why MTBF might decrease and reasoned it is due to the occurrence on RET of several concerns, which were initially judged to have low probability of occurrence and sometimes also a low chance of detection on RET. Examination of the raw data indicates additional concerns have been raised post-RET and that the reduction in the chance of existing concerns was marginal across the set. Investigations suggest this apparent contradiction appears due to engineers increased familiarity with the design and its
environment gained through test giving rise to articulation of additional concerns. Despite the initial counterintuitive results, Rolls Royce valued the process believing it provides a “quantitative analysis of reliability risk and a method of engineering experience tracking.” The process and the results have been used as part of the reliability case of evidence to the customer and the regulatory authority because the approach was considered more defensible than the traditional MIL-HDBK-217 analysis. Elicitation of engineering judgment underpins this application and the company believes it captures the “evolution of the expert view over the project time-span.” Like earlier projects, elicitation of the potential failure modes worked well; however, obtaining judgment about time to realization was more challenging, in part because of the nature of the data required, which could be overcome by training the engineers in probability assessment and, in part, because the selection of engineers must include people who understand how the failure mechanisms might manifest themselves under operating stresses drawing upon analysis of physics of failure [3] as well as experience with operational reliability. VI. REFLECTIONS, CONCLUSION, AND FURTHER WORK Table IV summarizes the impact of modeling across all projects for the criteria identified in Section III and, using a three-point scale, translated qualitative feedback into a summary impact measure. A. Reflections and Lessons Learned Variation in impact of modeling can be attributed to several factors. First, an organization’s ability to assume responsibility for reliability influenced the usefulness of the model. In some cases, the customer aspired to progressive assurance, but inertia implied that there remained an attitude consistent with prescription, which inhibited opportunity for enhancement. Second, time effects mean both modelers and industry are on a learning curve. For example, later projects used modeling on the critical path, while earlier projects supported a feasibility study. Third, product characteristics impact ease of modeling. For example, electronic systems have been more complex to analyze than mechanical items because of the high parts count, configuration complexity, and technology–environment interactions due to variation in size and stresses. For example, Goodrich have found that “lining up service fault categories with concerns categories is difficult because level of knowledge of the former is much higher than the latter.”
272
IEEE TRANSACTIONS ON ENGINEERING MANAGEMENT, VOL. 53, NO. 2, MAY 2006
TABLE IV EVALUATION OF MODELING IMPACT WITHIN INDUSTRIAL PROJECTS ON THREE-POINT SCALE
All organizations have internalized the modeling process in different ways. For example, Goodrich has integrated the process for its reliability procedures supported by an information system with connections to in-house databases that is an on-line embodiment of the methodology, with repositories of best practice guides for use of reliability tools generated from the experience of the consortium. Similarly, Smiths have introduced flowchart procedures tailored to process as means of “creating a best value approach to establishing and validating the reliability of an equipment” believing this requires “less effort to be expended on analysis and testing to ‘prove or disprove’ problems that might be realized on aircraft.” Elicitation of subjective engineering judgment made the most consistent high impact. Feedback from all projects indicates designers and other engineers welcomed the opportunity to contribute, with elicitation making previously tacit knowledge explicit and providing a systematic approach to extracting and recording traceable data. For example, Smiths believe that the elicitation “process allowed a better (more rounded) understanding of the products to all the participants from the various disciplines” which in turn led to “better understanding which meant solutions were more likely to be successful at eliminating or mitigating the problem.” Interestingly, during the first research phase, the industry was skeptical about the validity of expert judgment because there was a belief that subjective probability data would be of dubious quality in comparison with objective failures from test or operation. As researchers, we believe the processes for collecting structured expert judgment are at least as scientific as those designed to collect in-service data and, given the novelty, the processes are open to more scrutiny. Further, the timely feedback of information to the design team has been highly valued and overcome one of the major shortcomings of traditional methods such as FMEA [44]. Operational event data is an invaluable source of information giving insight into the actual stresses experienced by products. Exploratory analysis has provided insights into the impact of different environments, routings, and operator policies on relia-
bility of direct value to the project team. However, there exists the usual problem with secondary data, for example, missing data, lack of standardization, and status details of products not in operation. The complexity of the supply chain combined with different operator policies, standardized company reporting systems, and emphasis on simplistic management indicators means that at each stage in transference of data much of the information content is lost. The model is based on the premise of a learning curve, although one where monotonic improvement in reliability is not required. Hence, when projects showed that “experts were observed to become more concerned over time which reflects their increased knowledge of the item design and its intended aerospace environment,” as identified by Rolls Royce, then the anticipated dip in the reliability profile shown in Fig. 1 is observed. B. Conclusion and Further Work The exposition of the theoretical model in Section III and the evaluation of its implementation in Section IV demonstrate that the two research propositions have been satisfied. The integrated process of planning reliability and developing a case of evidence based on a common model, depicted in Fig. 2, has been achieved and partially validated. Since aerospace products have long development times and service lives, it has not been possible to fully validate the model since observations from operation are not yet available. Hence, validation to date has relied on the perceptions of the project teams in terms of the value they attach to the process, the comparison of results with standard models used in development and between subjective, and Bayesian updating when test data are available. At present, the transition from prescription to enhancement within the U.K. aerospace industry is not complete. Reference [20] examines possible reasons within the military sector and identifies several sources of inertia, the major one being senior management’s perception of reliability and its (lack of) importance. To be more persuasive, there is a need to extend modeling to include costing. This should help inform the planning cycle so
WALLS et al.: MODELING TO SUPPORT RELIABILITY ENHANCEMENT DURING PRODUCT DEVELOPMENT
that efficient, as well as effective, decisions are made and better communication reliability in a language is understood by senior management. Preliminary mathematical models have been developed to support cost-benefit analysis [45] but have not yet been evaluated in anger and require further research. ACKNOWLEDGMENT The authors would like to thank all partners within the REMM team, especially R. Hodge, for his facilitation skills, and the engineers who contributed to the process. They also wish to thank the referees for their critical feedback, which has resulted in an improved paper. REFERENCES [1] N. Slack, S. Chambers, and R. Johnston, Operations Management. London, U.K.: Prentice–Hall, 2001. [2] IEV 191, Int. Electrotechnical Vocabulary IEC, Geneva, Switzerland, 1990. [3] P. D. T. O’Connor, Practical Reliability Engineering. New York: Wiley, 2002. [4] W. Q. Meeker and L. A. Escobar, “Reliability; The other dimension of quality,” Quality Technol. Quantitative Manage., vol. 1, no. 1, pp. 1–25, 2004. [5] L. W. Condra, Reliability Improvement With Design of Experiments. New York: Marcel Dekker, 1993. [6] T. P. Davis, “Reliability improvement in automotive engineering,” in Global Vehicle Reliability—Prediction and Optimization Techniques, J. E. Strutt and P. L. Hall, Eds. London, U.K.: Professional Engineering, 2003. [7] D. Clausing, Total Quality Development—A Step-by-Step Guide to World Class Concurrent Engineering. New York: ASME, 1994. [8] ATT, Reliability by design ATT, Rep., Indianapolis, IN, 1990. [9] W. R. Blischke and D. N. P. Murthy, Reliability: Modeling, Prediction and Optimization. Chichester: Wiley, 2000. [10] K. G. Swift, M. Raines, and J. D. Booker, “Case studies in probabilistic design,” J. Eng. Design., vol. 11, no. 4, pp. 299–316, 2000. [11] G. Thompson, J. S. Lui, and L. Hollaway, “An approach to design for reliability,” in Proc. Inst. Mech. Eng., 1999, vol. 213, no. E, pp. 61–67. [12] J. Bowles, “An assessment of RPN prioritization in a failure modes and effects criticality analysis,” in Proc. RAMS2003, Tampa, FL, 2003. [13] V. Krishnan and K. T. Ulrich, “Product development decisions: A review of the literature,” Manage. Sci., vol. 47, no. 1, pp. 1–21, 2001. [14] G. S. Wasserman, “Design for reliability—Megatrends to look out for,” in Proc. 51st Annu. Quality Congr., 1997, pp. 861–868. [15] S. Minderhoud, “Quality and reliability in product creation—Extending the traditional approach,” Quality Reliability Eng. Int., vol. 15, no. 6, pp. 417–425, 1999. [16] F. M. Reed and K. Walsh, “Enhancing technological capability theorugh supplier development: A case study of the U.K. aerospace industry,” IEEE Trans. Eng. Manage., vol. 49, no. 3, pp. 231–242, Aug. 2002. [17] J. Marshall, L. Walls, and J. Jones, “Reliability enhancement methodology and modeling—The REMM project,” Aeronautical J., vol. 106, pp. 194–201, 2002. [18] D. Gaver, P. A. Jacobs, and E. Seglie, “Modern military acquisition and the ramifications of RAMS,” in Proc. ESREDA Seminar, Glasgow, U.K., 2004, pp. 90–103. [19] Reliability and Maintainability Assurance Guidance, Part 3 The R&M Case U.K. Ministry Defence, London, U.K., DEF-STD 00-42 Part 3. [20] T. Jefferis, “The drive for progressive assurance within the MOD,” in Proc ESREDA Seminar, Glasgow, U.K., 2004, pp. 145–156. [21] W. I. Zangwill and P. B. Kantor, “Toward a theory of continuous improvement and the learning curve,” Manage. Sci., vol. 44, no. 7, pp. 910–920, 1998. [22] J. T. Duane, “Learning curve approach to reliability monitoring,” IEEE Trans. Aerospace, vol. 2, no. 2, pp. 563–566, 1964. [23] W. Jewell, “A general framework for learning curve reliability growth curves,” Oper. Res., vol. 32, no. 3, pp. 547–558, 1984.
273
[24] J. I. Ansell and M. J. Philips, Practical Methods for Reliability Data. London, U.K.: Oxford Univ. Press, 1994. [25] W. R. Blische, “Bayesian formulation of the best of liquid and solid reliability methodology,” J. Spacecraft Rockets, vol. 31, pp. 297–303, 1994. [26] W. J. Kerscher, J. M. Booker, and M. M. Meyer, “PREDICT: A case study,” in Proc ESREL 2001. [27] M. Neil, N. Fenton, S. Forey, and N. Harris, “Using Bayesian belief networks to predict the reliability of military vehicles,” Computing Contr. Eng. J., vol. 12, no. 1, pp. 11–20, 2001. [28] C. Eden and C. Huxham, “Action research for management research,” British J. Manage., vol. 7, no. 1, pp. 75–86. [29] N. Kock, R. J. McQueen, and J. L. Scott, “Can action research be made more rigorous in a positivist sense? The contribution of an iterative approach,” J. Syst. Inf. Technol., vol. 1, no. 1, pp. 1–24, 1997. [30] R. Bales and Z. Radnor, Changing World of Aerospace Supply Webs: Supply Chain Management, vol. 4, no. 1, pp. 4–14, 2002. [31] M. Easterby-Smith, R. Thorpe, and A. Lowe, Management Research: An Introduction. London, U.K.: Sage, 1991. [32] T. Bedford and B. Lindqvist, “The identifiability problem for repairable systems subject to competing risks,” Advances Appl. Probability, vol. 36, pp. 774–790, 2004. [33] M. Merkhofer, “Quantifying judgmental uncertainty: Methodology, experiences and insights,” IEEE Trans. Syst., Man, Cybern., vol. 17, pp. 741–752, Jun. 1987. [34] S. Spetzler and S. von Holstein, “Probability encoding in decision analysis,” TIMS, vol. 22, pp. 340–358, 1975. [35] G. A. Kelly, The Psychology of Social Constructs. New York: Norton, 1955, vol. 1 and 2. [36] R. L. Keeney and D. von Winterfeldt, “Eliciting probabilities from experts in complex technical problems,” IEEE Trans. Eng. Manage., vol. 38, no. 3, pp. 191–201, 1991. [37] R. Hodge, M. Evans, J. Marshall, J. Quigley, and L. Walls, “Eliciting engineering knowledge about reliability during design—Lessons learnt from implementation,” Qua. Reliab. Eng. Int., vol. 17, pp. 169–179, 2001. [38] L. Walls and J. Quigley, “Building prior distributions to support Bayesian reliability growth modeling using expert judgement,” Reliability Eng. Syst. Safety, vol. 74, pp. 117–128. [39] J. Quigley, L. Walls, and R. Hodge, “Eliciting prior distributions for potential system faults from correlated experts,” in Proc. Eur. Safety Reliability Conf., 2000, pp. 325–330. [40] J. Quigley and L. Walls, “Nonparametric bootstrapping of the reliability function for multiple copies of a repairable item modeled by a birth process,” IEEE Trans. Reliability, vol. 54, no. 4, pp. 604–611, Dec. 2005. [41] J. Kalbfleisch and R. Prentice, The Statistical Analysis of Failure Time Data Second Edition. New York: Wiley, 2002. [42] US MIL-HBK-217, Reliability prediction for electronic systems Available from the Nat. Tech. Information Service, Springfield, VA. [43] R. M. Cooke, Experts in Uncertainty. London, U.K.: Oxford Univ. Press, 1991. [44] J. Jones, J. Marshall, and B. Newman, “The reliability case in the REMM methodology,” in Proc. Reliability Maintainability Symp., 2004, pp. 25–30. [45] J. Quigley and L. Walls, “Cost-benefit modeling for reliability growth,” J. Oper. Res. Society, vol. 54, pp. 1234–1241, 2003.
Lesley Walls received the B.Sc. degree in applicable mathematics from the University of Abertay, Abertay, U.K., and the Ph.D. degree in applied statistics from Nottingham Trent University, Nottingham, U.K. She has served as a U.K. Expert to IEC/ TC56/WG2 on reliability analysis. At present, she is a Professor of Management Science, University of Strathclyde, U.K. She has served on the Editorial Boards of the Journal of Statistical Computation and Simulation, Quality and Reliability Engineering International, and Journal of Risk and Reliability. Her current research interests include reliability modeling, business processes, applied statistics, and risk assessment. Dr. Walls is a Fellow of the U.K. Safety and Reliability Society, a Chartered Statistician, and a member of the Operational Research Society.
274
IEEE TRANSACTIONS ON ENGINEERING MANAGEMENT, VOL. 53, NO. 2, MAY 2006
John Quigley received the B.Math. degree in actuarial science from the University of Waterloo, Waterloo, ON, Canada, and the Ph.D. degree from the University of Strathclyde, Strathclyde, U.K. At present, he is a Senior Lecturer in Management Science, University of Strathclyde, U.K. His current research interests include applied probability modeling, statistical inference, and reliability growth modeling. Dr. Quigley is a member of the U.K. Safety and Reliability Society, a Chartered Statistician, and an Associate of the Society of Actuaries.
Jane Marshall received the B.Sc. degree from the University of Abertay, Abertay, U.K., and the Ph.D. degree from the University of Loughborough, Loughborough, U.K. Her work experience includes 12 years as a Reliability Analyst at Goodrich Engine Controls. She has served as a U.K. Expert to IEC/TC56/WG2 on reliability analysis. At present, she is a Teaching Fellow at the Warwick Manufacturing Group, University of Warwick, U.K. Her current research interests include reliability analysis and quality management. Dr. Marshall is a Chartered Statistician.