Multilayer perceptron network (MLP) has been used by Cathy Wu et al. for ..... [5] Cathy H. Wu and J. W. McLarty, âNeural networks and genome informatcis vol 1 ...
1
Chapter 1 PROTEIN CLASSIFICATION USING NEURAL NETWORKS: A REVIEW Nung kion Lee, Dianhui Wang, and Kock wah Tan Abstract This paper presents an overview on the application of neural networks (NN) in bioinformatics, specifically in the classification of protein family/superfamily. Protein classification is important for both biological data analysis and knowledge discovery. NN has been one of the most widely used methods for protein classification. In this paper, detailed discussion of protein classification processes using NN is presented with emphasis on the various protein sequences feature extraction and neural classifier design. Some other related issues and future challenges are discussed at the end of the chapter.
INTRODUCTION A protein superfamily comprises set of protein sequences that are evolutionary and therefore functionally and structurally related. One of the benefits from this grouping is that some molecular analysis can be carried out within a particular superfamily instead of individual protein sequence. This can facilitate investigation of the functions of genes of an unknown sequence and could help provide valuable information. There are numerous ways to establish superfamily/family. For example, in Protein Information Resource (PIR) protein annotated databases [1], each superfamily is a collection of families. Sequences in these databases are grouped into the same superfamilies if they share at least 50% in overall identity. These identities are the end-to-end sequence similarity, including common domain architecture, and do not differ too much in overall length [2]. Usually, two protein sequences are assigned to the same class if they have high homology in the sequence level. Evidence of homology from these data shows that the genes may share a common evolutionary past (i.e., common ancestor). This is based on the first fact of biology sequence analysis that “if two peptides stretches exhibit sufficient similarity at the sequence level, then they are likely to be biologically related” [3]. Two of the classic well known algorithms to establish this homology measures are Smith-Waterman and Needleman and Wunsch. Due to increasing number of molecular sequences, comparison between a query protein and proteins in database is an expensive operation. With improvement in the speed of sequence alignment algorithms (e.g., BLAST, and PatternHunter) and advances made in computer power, these tools are still practical for small to medium sized biological sequence databases. Currently and in the future, where the number of genomes is expected to be in the millions and with the availability of more complete genomes, these methods would become less practical. Artificial intelligence technique such as neural network has been one of the most frequently used machine learning techniques in bioinformatics. The input-output mapping capability of NN can predict the degree to which a query sequence belongs to a superfamily/family; subsequent further analysis with reduced scope can be carried out by using sequence alignment tools. The neural network is also known for its tolerance to noise data due to mistake in the process of acquiring molecular data or incompleteness in the sequence data. The neural network can be used for proteins classification based on the information content of the protein sequences. A protein sequence comprises a sequence of amino acid combination derived from twenty known amino acids. The set of abbreviation for the amino acids is represented by å ={A, C, D, E, F, G, H, I, K, L, M, N, P, Q, R, S, T, V, W, Y}. An example of protein sequence is
2
AGDAAAGEDKIGTCVACHGTDGQGLAPIYPNLTGQSATYLESSIKAYRDGQR KGGNAALMTPMAQGLSDEDIADIAAYYSSQE Each letter in S can be repeated in any order and at any location in a protein sequence. The length of a protein could vary from as short as ten to as many as a few hundred letters (complete genomes can reach millions of bases). This chapter is organized as follows: Section 1.2 discusses the protein classification processes; Section 1.3 discusses several protein feature extraction and representation; Section 1.4 gives an overview of four neural classifiers for protein classification; Section 1.5 provides some comments and future direction in the field of protein classification, and the final section gives the conclusion of the chapter.
1.1
NEURAL PROTEIN CLASSIFICATION PROCESS
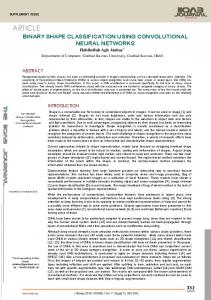
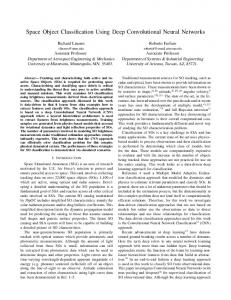
Fig. 1 depicts the process for protein sequence classification. The pre-processing step involves feature representation and input encoding. The original letter S can be further represented using real-numbered measurements such as mass, hydrophobicity scales, their physicochemical properties, domain and context features, or evolutionary features [4][5]. After deciding on a suitable representation, sequences can then be optionally processed by feature extraction or feature selection algorithms. Feature extraction or encoding algorithms extracts maximal information from protein sequence representation to be used as input to the neural classifier. The encoding may be local or global, or direct or indirect [5]. Encoding of local features involves only single or neighboring residues in a short sequence segment, whereas global feature involves long-range relationship in a full-length sequence or long sequence segments [5]. Section 1.3 discusses both features in more detail. Outputs obtained from the protein classification neural network are the pre-classified homology (functionally or structural related) protein superfamilies. Usually for a NN classifier, outputs are encoded by assigning each superfamily to a targeted output vector. The size of the output layer is similar to the number of superfamilies in the training dataset. The 1-of-p coding is the most commonly used output encoding method [5], with p representing the number of output classes.
Protein sequences
Pre-processing
Feature representation, and input encoding.
Neural classifier
Network architecture, learning algorithm, and parameters.
Postprocessing
Output encoding.
Fig. 1. Protein classification processes (Adapted from [5])
On ascertaining the input-output mapping, the NN architecture and configurations have to be subsequently determined. We need to decide on the neural architecture to use, as well as the learning algorithm and the parameters involved in the training. These are the most difficult decisions requiring
3 experience and knowledge, owing to the sophistication of the problem domain. Finally, the postprocessing step involves interpreting the results and making classification decisions.
1.2
PROTEIN FEATURES ENCODING
Feature extraction reduces the information content of the protein sequences by reducing unnecessary information while retaining features that needed to discriminate from sequences in other superfamilies. The sequence of amino acid letter from a protein sequence need to be transformed into a fixed number of numeric variables before it could be applied as inputs of NN. There are two main features that we could extract from protein sequence(s): the local features and the global features. Techniques for feature extractions can also be classified into: i) string based, ii) biological based, and iii) hybrid.
1.2.1 Local Features A motif or consensus or conserved region is a short sequence frequently found in a group of related protein sequences. Protein sequences contain patterns or motifs preserved in evolution due to the important in the structure or function of molecules. These motifs provide evidence that the protein sequences are evolutionary related. Through grouping of protein sequences into superfamily (e.g. the PIR database [1]), we could use automation tools to discover these motif segments. Many motifs discovery tools are developed for this purposes, for examples Pratt [7], ClustalW [8], and Sdiscover [9]. Patterns discovery tools are used to discover one or more motif patterns to describe the protein sequences in a protein superfamily/family. In PROSITE, each family is modeled by one or several motif patterns. A query protein sequence can be matched to these patterns to ascertain the presence of these motifs. If the score of the matches exceeds a certain threshold, we can conclude that the protein sequence has high possibility of belonging to that family. These motif features are local because they involve subsequence comparison only. Motif patterns come in many forms. Fig. 2 gives some examples from the literature and public domain databases. In Fig. 2, motif pattern (i.) is used in the PROSITE protein databases [10]. These motif patterns are described by -, [], (), x, and {} symbols (interested reader may refer to for details). The BLOCKS [11] (e.g., see ii. in Fig. 2) protein databases use a set of fixed length short sequences as the motif pattern for a family, while in iii. [12], motifs are represented by substrings with wild card symbol ̀* ́. The wildcard can be matched to any amino acid letters of any length. The match between a query sequence and motif patterns is usually based on string based regular expression that allows only matched or unmatched choices. Some motif patterns also allow approximate matching. The local context features are based on the neighboring content information of sub-sequences of size w. The context features could be the frequency count of a single or pair of amino acid letters to the left and right of the sub-sequence. These context features can be converted into feature vectors. i. PROSITE
C-x(2,4)-C-x(3)-[LIVMFYWC]-x(8)-H-x(3,5)-H ii. BLOCKS
AILGQSHMNI AMPEQQRILI AVGDQTRSAI AVGEQLHAAI
AVANQHHWCI AIDEQELASI Fig. 2. Motif patterns
iii. Short substrings and wildcard
*MAGL* *MAGLL* *MKAR* *MKSP* *MRAL* *MLEK*
4 Although motif features are important in biological analysis, it is not widely used as NN input on the following grounds: i) NN requires a fixed number of input features but different protein families have different set of motifs; ii) Motifs in a superfamily are not unique to a superfamily. Some may overlap with motifs in other superfamilies. Furthermore, even within a superfamily, it is hard to distinguish between a true and a false motif and which, has more significance. Generally, two methods can be used to apply the motif features as NN inputs: first, apply the extracted or pre-processed motif features as numerical input values to NN input units; second, integrate the motif patterns into the NN architecture. In the formal method, a matching function between a protein sequence and a motif pattern is usually defined to create a matching score. The scored value between a protein sequence (test/train) and all the superfamilies motif patterns can be applied as NN input value. In [13], the score is simply a match value ‘0’ or unmatched value ‘1’. While in another work the score was the similarity in value between a protein sequence and a set of short motifs [12]. The matching function can be the regular expression or any inexact string matching algorithms that support motif patterns syntax. Inexact matching may be more attractive due to incompleteness of protein data either in the query sequence or sequences database.
Table 1. Alphabet sets for feature representation [5][14]
Alphabet Name AAIdentity
Size 20
ExchangeGroup
6
ChargePolarity Hydrophobicity Mass Structural 2Dpropensity
4 3 3 3 3
Chemical alphabet
8
Membership A,C,D,E,F,G,H,I,K,L,M,N,P,Q,R,S,T,V,W,Y {HRK}{DENQ}{C}{STPAG}{MILV}{FY W} {HRK} {DE}{CTSGNQY}{APMLIVFW} {DENQRK}{CSTPGHY}{AMILVFW} {GASPVTC}{NDQEHILKM}{RFWY} {DENQHRK}{CSTPAGWY}{MILVF} {AEHKMLR}{CTIVFYW}{SGPDN} {DE}{AGILV}{NQ) {FWY} {RHK} {ST} {P}{CM}
1.2.2 Global Features The n-gram string based global feature extraction is the most commonly used features in NN protein classification. Given the amino acid letters , the n-gram features are a pair of values (vi, cnti), where vi n depicts the i-th feature and cnti is the counts of this feature in a protein sequence for i = 1… ||n. In general, an n-gram feature is the number of occurrences of that feature in a protein sequence counted in a sliding window size of n. These features encompass all n-permutations of letters from . For example, the 2-grams (400 in total) features in the 20 amino acid letters are (AA, AB, …, AY, BA, BB, …, BY,…, YA, …, YY). Some authors use the term dipeptide composition for 2-gram features, kstring, or k-tuples. Some advantages of the n-gram features are [15]: i. It allows the use of sequences of various lengths, and maps them to feature vectors with the same dimension size. A long sequence can be used to increase the uniqueness of the pattern without a corresponding increase in the number of input units; ii. It provides certain representation invariance with respect to letter insertion or deletion (i.e. gaps); thus, it can more readily identify multiple regions of similarity within sequences, and; iii. It is independent of the a priori recognition of certain specific patterns. Amino acids can be grouped according to their physicochemical, structural, and evolutionary features. These groups are formed by distinct subsets from the 20 amino acid letters. For example, exchange groups arising from evolutionary processes are {MILV}, {FYW}, {STPAG}, {DENQ}, {HRK}, and
5 {C}. By representing each group with a symbolic letter, we could transform a protein sequence into new compositions. Table 1 gives examples of alphabet sets for feature representation. The n-gram features count is normalized into [0, 1] using equation (1).
cnti'
cnti k n 1
(1)
where cnti is the n-gram count of the i-th feature and k is the length of the protein sequence. For multiple n-gram feature vectors, each of them is scaled separately to avoid skew on the count value. Some limitations of n-gram features are: a)
The number of features increase exponentially with the size of n. This results in high dimensional feature vector which required long training time; b) It is unknown what the appropriate value of n is. However in the literature, the 2-gram is the most commonly used [16]; c) When n is increased, the number of counts associated with each feature will be decreased; d) Some information is lost because only neighboring residues are taken into account; and In practice the n-gram features size is reduced by applying feature selection algorithms. Actual experiments in [12][17] shows that the reduced number of features for more than 50% for 2-gram can still produce an accuracy of more than 90% in proteins classification.
1.2.3 Direct Encoding Direct encoding convert the protein sequences into number representation as neural network inputs. Two commonly used string based direct encoding are: binary encoding and real value encoding. Binary encoding method represents each letter in å with a binary number. Usually a 1-of-20 encoding method is used that require 20 bits. For proteins of different length an additional bit is required for the gaps appeared when they are align together (e.g., in [16]). Binary encoding has been widely used in other bioinorganic problems as well.
DEFG 01000000000000000000 00000000000001000000 00000000001000000000 10000000000000000000 Fig. 3. Binary encoding
In real value encoding, each letter in å is assigned an integer value (e.g., value 1 to 20). Like the binary encoding, the problem of uneven sequences length can be solved using sequence multiple alignment algorithms. [18] has used real value encoding method for three types of influenza viruses classification. The direct encoding methods for machine learning rely greatly on the accuracy of the data, but this limitation is offset by the tolerance of neural-network to inaccuracy of input patterns.
1.3
NEURAL PROTEIN CLASSIFIER
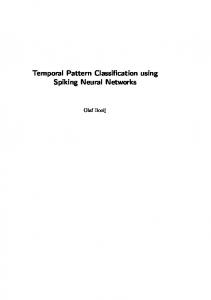
1.3.1 Multilayer Perceptron Network Multilayer perceptron network (MLP) has been used by Cathy Wu et al. for protein/RNA/DNA classifications (see [15], [19]-[24]). They developed several large-scale systems such as proCANS [19], GenCANS [25 ], MOTIFIND [22] and NACANS [26]. Their main working domain is on the annotated Protein Identification Resources-Protein Sequence Database which using CANS NN interactive
6 system. All these neural classifier system use the n-gram features as inputs, with the exception of MOTIFIND that also uses the motif feature vectors. Since the number of n-gram features is large, the training time required will be quite significant. However, many techniques have been proposed to reduce the MLP neural network training time [19][20]. Protein superfamilies
…
MLP
0.1 0.5 M 0.6
M
Combine outputs
Feature vector
Encoding module
M
Fig. 4. Neural classifier task decomposition
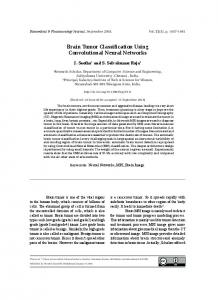
As seen in Fig. 4, training time of NN is reduced by applying task decompositions and modularization techniques. Protein superfamilies from the protein database are first divided into functional domain. There are one or more superfamilies in each domain. The n-gram feature vectors are extracted from these domains, divided into different encoding module with each having distinct set of features. Each NN in the encoding module is trained separately with the final results combined using either the product or average rules. This decomposition design can significantly reduce training time. In MOTIFIND (see Fig. 5), one NN is used for each superfamily. The training set of the systems comprises both the positive and the negative training sets. The positive training set is the true protein sequences which belong to one of the superfamilies, whereas the converse is true for the negative training set. Negative training set aims to avoid false positive in predicting data outside the training classes and to enhance generalization. Different ratios between the positive and the negative training data set have been used for training. But result shows that “…the number of negative patterns had little effect on the predictive accuracy as found in preliminary studies where ratios ranging from 1:1 to 1:10 were tested” [22]. Local (motifs) feature vectors term weight input vector
protein sequences
+F . . .
n-gram encoding -
Global feature (n-gram) Fig. 5. MOTIFIND architecture
. . .
+M -F -M
7 Strategy has been devised to reduce the input size of n-gram features. In [21], Singular Value Decomposition (SVD) is used to reduce the size of n-gram vectors and to extract semantics from the ngram patterns. Most of the early works on MLP neural classifier involve global protein sequence features only. The use of protein motifs to enhance predictive performance is found in [22]. The NN classifier MOTIFIND is used in tandem with the sequence alignment algorithm is part of the GeneFind [24]. In MOTIFIND, term weight is used to include the local motif feature. The motif is obtained by multiplying each n-gram (from n-gram vector) to its term weight. Eq. (2) is used to calculate the term weight. The weight factor is calculated by dividing the total n-gram count in all motif sequences (term frequency) with total n-gram counts in all full-length sequences of the training set (inverse set frequency) [22].
Wk
M
ik
i
F
(2)
ik
i
where Wk is the weight factor for the k-th n-gram term in the input vector, Fik, and Mik is the total count of the k-th n-gram term in the i-th sequence of the full-length sequence and motif sets. Motif patterns for each positive and negative training superfamily were obtained from the PROSITE [10] protein databases. There are 4 output units in the output layer. These units are the target classes for both the motif (+M, -M) and the global (+F, -F) vectors (positive and negative sets). Results showed significant saving time as compared to the BLAST sequence alignment method for protein classification (i.e., 35,116 seconds were required to classify 43,470 sequences, whereas only 984 seconds was needed using MOTIFIND). The MOTIFIND has been claimed to be “…comparable to the BLAST database search method, but its speed is more than 20 times faster” [22]. In conclusion, MLP network has been successfully applied to molecular sequences classification. The performance of MLP neural network greatly depends on the quality of the protein features. Training parameters are heuristically determined in constructing classifier with good generalization abilities. Note that none of these requires priori information on the problem characteristics. Results show that MLP network performances on protein families with small members are poor [25]. Overall result is rather biased and misleading however because most of the protein families are large and this masks the poor performance of classes with small members. As reported in [25], “The neural network tends to give a higher score and better result when the sequence is in a large family, but worse result when the sequence belongs to a single-member family.”
1.3.2 Bayesian Network The Bayesian neural network is used in [27] & [9] for protein/DNA sequences classification. The Bayesian neural network is based on Mackay’s learning algorithm. Fig. 6 illustrates Bayesian neural network architecture. The n-gram and the local motifs features have been used as the network inputs. Motifs of a superfamily are described by wildcard (i.e., ‘’ as iii. in Fig. 2.) pattern format and, allowing for mutational elements (i.e., mismatch). Two of the motif formats employed are *X* and *X*Y*, where X and Y represent the short motifs. Mutation (insertion, mismatch or deletion) is allowed in matching a sequence to a motif. Short motifs were generated using the suffix tree algorithm [27] by specifying three parameters: the minimum length of motif, number of mutations, and their minimum frequency. Based on our experience using the Sdiscover [9] tool, the number of motifs generated by the program is sensitive to these parameters. A significant measure is used to reduce the size of the global feature (2-gram) to Ng. This measure is based on discrimination analysis that ranks these features according to their number of occurrences in true positive and false negative training data. A set of motif features is extracted from each superfamily using the Sdiscover tool. Applying the Minimum Description Length principle and the Shannon information theory, the most significant motif set for each superfamily is determined. A test (or train) protein sequence is compared to each motif set (from all superfamilies), and the highest weight of this outcome will be applied as one of the Bayesian network input (i.e., LS). Unfortunately, results show that these motif features have little effect on the Bayesian network performances. One
8 possible explanation is that much of the motif information is offset due to the “compression” of the motifs to a single network input. As in the MLP network, they conclude that “…it runs (Bayesian network) significantly faster than BLAST and SAM-T99 in sequence classification.” [27].
1.3.3 Unsupervised NN The most frequently used unsupervised network architecture for protein sequences classification is the Kohonen Self-Organizing Map (SOM). For example, [28], [29], [30] used SOM for protein family classification and [31] used Self-organizing tree-growing network (SOTA) for similar purpose. (Please refer to Chapter 11 for discussion on SOM neural network.) The unsupervised classifier maps the data from the high-dimensional input signal space to a twodimensional output space. That is a protein sequence which is converted into d dimensional feature vector (d > 1) is mapped onto a two-dimensional cell (i, j) (column i and row j) array on the Kohonen layer. Thus, the algorithm provides a two-dimensional geometrical representation of the relationships in the features of the protein sequences learned. The main advantage of unsupervised classification is it can be used to discover new protein sequences without prior knowledge of the data set. This is particularly useful for pattern discovery and analysis of diversified datasets [31].
Fig. 7. RBF neural protein classifiers
In [30], a 20 20 matrix (i.e., 400 components) feature obtained from the bipeptide composition of the protein sequences is used as SOM network inputs. The network is trained with these normalized input patterns (vectors) to produce an SOM map, in which related proteins are associated either to a single neuron or the neighboring ones. Upon training, each cluster is analyzed to determine if its members are related biologically. Results show that the SOM network is able to cluster phylogenetically related and high homology protein sequences into correct cluster [32]. Euclidean distances between the input vectors and synaptic node of SOM can be sorted in a decreasing order to further classify the protein sequences and thus, help to construct a hierarchical tree of protein classification [29]. There are some limitations in the unsupervised SOM network for protein classification. The optimal number of cells in the Kohonen layer is usually determined empirically by statistical methods [31]. It is difficult to determine the optimal number of neurons used in the Kohonen layer without the knowledge of protein sequences. This makes the interpretation of the result difficult. Training time of the SOM network is quite significant, for example in [30], it took 14.7 hours to train 447 protein sequences. The main advantage of the unsupervised NN lies in its auto search for protein clusters, even if the protein sequence families are unknown.
1.3.4 Radial Basis Function Network (RBF) RBF NN is one with radial function as hidden unit activation function. This function could be the Gaussian, the inverse multiquadries, or the thin-plate splines function. Fig. 7 illustrates the standard RBF network. Surprisingly, the RBF network has not been widely used in bioinformatics application as compared to the MLP network. This is because the MLP network learning algorithm is well developed and simple
9 and its implementation can be easily obtained free or from commercial product. In [33], comparisons between the MLP and RBF neural networks for protein classification were made. The derivative based RBF network was used using two cost functions: the mean squared error (MSE) and the cross entropy (CE). In [33], the 1-gram AAIdentity (see Tab. 1) and the 2-gram exchange group features are applied to the standard RBF network for protein classification. Experiments show that the standard RBF network can achieve comparable results to the MLP network, even with better result when the CE cost function is used nd shorter training time.
Fig. 8. GRBF network
The RBF network also produces higher prediction quality (higher output values for predicted class and clearer values gaps between the predicted class and the other output classes) when the CE cost function is used. In [34], the modular RBF network has been used for proteins classification. This modularity arises as a result of using two modular (smaller) RBF networks employing different set of n-gram feature, with the results combined using a single layered network. The two RBF networks are trained offline and their results used as inputs to the single layered network. This network has several attractive features. First, it reduces the model variance of a single classifier by assigning different weights to the outputs of networks. Secondly, it speeds up the learning process due to the reduction in feature size for each network. This also allows parallel execution of the two modular RBF networks. Besides the standard RBF network, a generalized RBF (GRBF) network [34], [35] has also been proposed for protein classification. Although it is designed as general neural classifier, its performance in protein classification is nothing short of brilliance. Fig. 8 illustrates the GRBF network architecture. GRBF network architecture is set up by using a clustering algorithm. Each hidden unit is equipped with an ellipsoidal shaped cluster obtained using EM clustering algorithm with diagonal co-variance matrix. The hidden units are connected only to output neuron of the same class with unit weight associated with each connection. GRBF classifier utilizes the Feature SUBset Selection algorithm FSUBS and the Genetic Algorithms (GA) to optimize network parameters. FSUBS algorithm selects the most representative feature in each hidden unit to minimize overlapping with the hidden unit from other classes. Besides, the GA algorithm further reduces overlapping by optimizing cost function designed to minimize misclassification rate and maximize classification rate [34],[35]. GRBF network results prove that it performs better than the MLP and the standard RBF network [34]. [36] has proposed a Bio-basis Function network for protein classification. Unlike the standard RBF function, a bio-basis function is incorporated as the RBF network hidden unit radial function. This kernel function is given in Eq. (3),
10
f ( x, xn ) exp(
s( x, xn ) n
n
)
(3)
where x and xn are protein sequences, s is the pair-wise similarity function, a is a constant, and bn is the maximum similarity measurement associated with the nth basis function. One unique feature of this architecture lies in its variation in the number of input sizes. The size of the input is determined according to the length of the input protein sequence. Hence, protein sequence is applied to the network without feature extraction. The number of bio-basis functions is equivalent to the number of protein sequences in the training data set. Each bio-basis function is assigned with a protein sequence xn. This result in m × m dimensions matrix with each entry of the matrix is the pairwise alignment similarity between two sequences (m is the number of training data). With all the similarities of protein sequences in hand, the weights value for the network can be calculated directly using the pseudoinverse technique [36]. The limitations of the bio-basis function network are: i) if the training data set is large, the number of hidden units will be huge, and ii) the matrix pseudo-inverse operation used to calculate the weights result in network that is sensitive to noise and memorization not generalization [37].
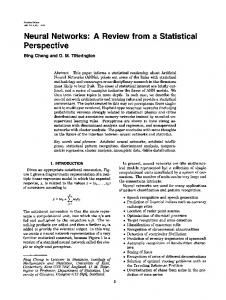
1.3.5 Neural Fuzzy System B. Chang & Halgamuge have proposed a protein motif pattern extraction method and use the neurofuzzy system to optimize the patterns for classification [38]. The discovered motif patterns are in fact the reduced version of the PROSITE motif pattern because only the wildcard symbol is used. An example of protein motif feature is CCH, where Æ is a wildcard symbol that matches any single letter in . A neural fuzzy system is a trainable RBF neural network with each hidden unit having one membership function. Upon training, the membership function can be used as fuzzy rules to model the problem domain. Fig. 9 depicts the neuro fuzzy system protein classification process. As seen in Fig. 9, through pre-processing, a set of short motif is obtained from protein sequences in a family. These short motifs are described by event and event interval in the form of y1-k)-y2, where y1, y2 are single amino acid letters (event) while k represents the number of wildcard character (interval). An “important feature” is motif with frequency greater than a threshold value (e.g., percentage). By performing exhaustive search on the protein sequences in a family, the frequency of each possible motif pattern can be found. The most frequently found motifs are “connected” to form a longer motif pattern through Motif Generation. A set of motif candidates is produced and one of these candidates is selected to represent the motif pattern for that family. Basically, the one which results in minimum false positive and maximum true positive in classification would be selected. Preliminary Motif A family of protein sequence Sequence Preprocessing
Neuro-Fuzzy optimization
Protein motif
Classification System
Important Features Motif Generation
Motif Candidates Motif Selection
Fig. 9. Protein classification and motif extraction [38]
11 The neural fuzzy optimization process optimizes the preliminary motif pattern in order to increase classification accuracy. The motif pattern event interval (I i) is used to create the fuzzy membership function. Each membership function is assigned as the neuro classifier hidden unit (black nodes in Fig. 10). The most similar match (with minimum sum of squares) between a test (or train) protein sequence and the preliminary motif pattern is then determined. The inputs to the network are event intervals (i.e. Wi). Optimization of membership function is achieved by passing training data into the neuro-fuzzy system. Upon training, new membership functions at the hidden units are taken as optimized motif pattern to be used later for classification. The work by [38] is among the first to include motif features into NN architecture design. Careful design of architecture results in high classification accuracy and at the same time produces a motif pattern for each family. Test/train MKRHEMVAKHLVMFYY sequence matching E1 I1 E2 I2 … En
Preliminary motif
M1W1M2W2….Mn Best matches
… Membership function
Input layer
Hidden layer
Output layer
Fig. 10. Neuro fuzzy classifier
1.4
CONCLUSIONS AND SUGGESTIONS
This chapter gives an overview in proteins classification using NN and several sequence pre-processing methods. Several supervised and unsupervised neural networks classifier for protein classification are discussed. Despite wide appreciation of NN proteins classification, its application in practice is still very limited partly due to its incapability to explain the decision it takes. In biological research, it is important to explain these decisions (made by biological tools). In sequence pairwise alignment algorithm, for instance, they clearly show the segment(s) that match or otherwise. Perhaps, by including such explanatory power into neural architecture, it would be made elegant and its power enhanced. One possibility is to look into the hybrid system that combines the explanatory features of fuzzy logic and the optimization technique of NN. Results from [12][24] point out the limitations of relying on a single tool. As quoted in [12] “the four studied classifiers, BNN, BLAST, SAM and SAM-T99, complement each other; combining them yields better results than using the classifiers individually”. Given this, the crucial questions then become “What constitutes the optimal combination?” and “How could neural network play its role most efficiently?” To do so, we should take into consideration the strengths and weaknesses of neural networks and other biological tools before a better integrated tool can be produced. The use of motif features in NN is still very limited. Motif features are shown to be useful to the neural classifier performance [9]. The RBF network that allows the use of custom kernel function in hidden units to suit the problem is potentially useful when some prior knowledge on the domain is available.
12
1.5
REFERENCES
[1] Cathy H. Wu, H. Z. Huang, L. Arminski, J. Castro-Alvear, Y.X. Chen, Z.-Z. Hu, R. S. Ledley, K. C. Lewis, H.-W. Mewes, B. C. Orcutt, B. E. Suzek, A. Tsugita, C. R. Vinayaka, L.-S. Yeh, J., J. Zhang, and W. C. Barker, “The Protein Information Resource: an integrated public resource of functional annotation of proteins,” Nucleic Acids Research. vol. 30, no. 1. Oxford University Press, 2002. [2] Cathy H. Wu, H. Z. Huang, L.-S. Yeh., and W. C. Barker, “Protein family classification and functional annotation,” Computational Biology and Chemistry, vol. 27, no. 1, 2003, pp. 37-47. [3] A. Floratos, “Pattern Discovery in Biology: Theory and Applications,” P.H.D Dissertation, Dept of Comp. Sci. New York University, 1999. [4] D. W. Mount Bioinformatics: sequence and genome analysis. Cold Spring Harbor, New York: Cold Spring Harbor Laboratory Press, 2001. [5] Cathy H. Wu and J. W. McLarty, “Neural networks and genome informatcis vol 1,” Methods in computational biology and biochemistry, A. K. Konopka (series ed.). Elsevier, 2000. [6] C. M. Bishop, Neural networks for pattern recognition, Oxford:Clarendon Press, 1995. [7] J. Inge, Methods for finding motifs in sets of related biosequences. Dr. Scient. Dissertation, Department of Informatics, University of Bergen, 1996. [8] J. D. Thompson, D. G. Higgins, and T. J. Gibson, “CLUSTAL W improving the sensitivity of progressive multiple sequence alignment through sequence weighting, position-specific gap penalties and weight matrix choice,” Nucleic Acids Res. vol. 22, 1994, pp. 4673-4680. [9] J. T. L. Wang, Q.-C. Ma, D. Shasha, and Cathy H. Wu “Application of neural networks to biological data mining: A case study in protein sequence classification,” Proceedings of the Sixth ACM SIGKDD International Conference on Knowledge Discovery and Data Mining. 2000, pp 305-309. [10] L. Falquet, M. Pagni, P. Baucher, N. Hulo, C. J. A. Sigrist, K. Hofmann, and A. Bairoch, “The PROSITE database, its status in 2002,” Nucleic Acids Research, vol. 30, no. 1, Oxford University Press, 2002, pp. 235-238. [11] S. Henikoff, and J. G. Henikoff, “Amino acid substitution matrices from protein blocks,” Proc. Natl. Acad. Sci. 89, 1992, pp. 10915-10919. [12] J. T. L. Wang., Q.-C. Ma, D. Shasha, and Cathy H. Wu “New techniques for extracting features from protein sequences,” IBM systems journal, vol. 40, no. 2, 2001, pp. 426-441. [13] Mohammad Zaki N., Deris, S., and Arjunan S. N. V., “Assignment of protein sequence to functional family using neural network and Dempster-shafer theory”, Journal of Theoretics, vol. 5, no. 1, 2003. [14] Baldi P. and Brunak S., Bioinformatics, The machine learning approach, 2nd ed., London:MIT Press, 2001. [15] Cathy H. Wu, G. M. Whitson, and J. W. McLarty “Artificial neural system for gene classification using a domain database,” Proceedings of the ACM 18th Computer Science Conference, 1990, pp. 288-292. [16] H. C. Wang, L. G. De-La-Fraga Dopazo, L. G., Y. P., Zhu, and J. M., Carazo, “Self-organizing tree-growing network for the classification of protein sequences,” Protein Science, vol. 7, 1998, pp. 2613-2622. [17] Sharma, S., Kumar, V., Rai T. S., Bhavani, S. D., and Raju S. B., “Application of neural networks for protein sequence,” Proceedings of International Conference on Intelligent Sensing and Information Processing, 2004, pp 325-328. [18] Campitelli, L., Delledonne, L., and Salvini, A., “A neural network approach to protein sequence processing,” IEEE NORDIC Signal Processing Symposium (NORSIG 2000), June 13-15, Kolmarden, Sweden, 2000.
13 [19] Cathy H. Wu, A. Ermongkonchai, and T.-C., Chang, “Protein classification using a neural network protein database (NNPDB) system,” Proceedings of the conference on analysis of neural network applications, ACM Press, 1991, pp. 29-41. [20] Cathy H. Wu, G. Whitson, C. T. Hsiao, and C. F. Huang, “Classification artificial neural systems for genome research,” Proceedings of the 1992 Supercomputing Conference, 1992, pp. 797-803. [21] Cathy H. Wu, M. Berry, S. Shivakumar, and W. J. McLarty, “Neural networks for full-scale protein sequence classification: Sequence encoding with singular value decomposition,” Machine Learning, vol. 21, Kluwer Academic Publishers, 1995, pp. 177-193. [22] Cathy H. Wu, , H. L., Chen, C. J. Lo, and J. W., McLarty, “Motif identification neural design for rapid and sensitive protein family search,” Computer Application Biosci, vol. 12, no. 2, 1996, pp. 109-118. [23] Cathy H. Wu, “Artificial neural networks for molecular sequence analysis,” Computers Chemistry, vol. 21 no. 4, Pergamon Press Ltd, 1997, pp. 237-256. [24] Cathy H. Wu, S. Shivakumar, C. V. Shivakumar, and S.-C. Chen “GeneFIND web server for protein family identification and information retrieval,” Bioinformatics Applications Note, vol. 14, no. 2, 1998, pp. 223-224. [25] Cathy H. Wu, “Gene classification artificial neural system,” Methods Enzymol, 266, 1996, pp. 7188. [26] Cathy H. Wu, “Classification neural networks for rapid sequence annotation and automated database organization,” Computers Chemistry, vol. 17 no. 2, Pergamon Press Ltd, 1993, pp. 219227. [27] J. T. L. Wang, T. G. Marr, D. Shasha, B. Shapiro, and G.-W. Chirn, ”Discovering active motifs in sets of related protein sequences and using them for classification,” Nucleic Acids Res, 22, 1994, pp 2769-2775 [28] E. A. Ferran and P. Ferrara, “Topological maps of protein sequences,” Biol Cybern, 65, 1991, pp. 451-458. [29] E. A. Ferran and P. Ferrara, “Clustering proteins into families using artificial neural networks,” Comp Appl Biosci, vol. 8, no. 1, 1992, pp. 39-44 [30] E. A. Ferran, B. Pflugfedder and P. Ferrara, “Self organized neural maps of human protein sequences,” Protein Sci, 3, 1994, pp. 507-521. [31] H. C. Wang, L. G. D.-L.-F. Dopazo, P. Y. Zhu, and J. M. Carazo “Self-organizing tree-growing network for the classification of protein sequences,” Protein Science, vol. 7, 1998, pp. 2613-2622. [32] E. A. Ferran and P. Ferrara “A hybrid method for cluster protein sequences based on statistical and artificial neural networks,” Comp Appl Biosci, 96, 1993, pp. 71-680. [33] D. H. Wang, N. K. Lee, T. S. Dillon, and N. J. Hoogenraad, “Protein sequences classification using radial basis function neural networks,” In AI’02 Conference 2-6 December, Canberra, Australia, 2002. [34] N. K. Lee, Proteins classification using radial basis function network Master thesis (unpublished), La Trobe University Australia, Nov. 2002. [35] D. H. Wang, T. S. Dillon, and E. Chang “Data mining for constructing ellipsoidal fuzzy classifier with various input features using GRBF neural networks,” Proceedings of the IEEE international conference on artificial intelligence systems, Sept 5-10, Divnomorskoe, Russia, 2002. [36] R. Thomson, and R. Y. Zheng “A novel basis function neural network,” In ICONIP’02, 18-22 Nov, Singapore, 2002. [37] S. Haykin Neural Networks: a comprehensive foundation. Prentice-Hall. Inc., 1999. [38] B. C. H. Chang and S. K. Halgamuge, “Protein motif extraction with neuro-fuzzy optimization,” Bioinformatics, vol. 18, no. 8, 2002, pp 1084-1090