Journal of The Electrochemical Society, 148 共7兲 E313-E320 共2001兲
E313
0013-4651/2001/148共7兲/E313/8/$7.00 © The Electrochemical Society, Inc.
Luminescence of Exchange Coupled Pairs of Transition Metal Ions A. P. Vink,a,b, z M. A. de Bruin,a S. Roke,a P. S. Peijzel,a and A. Meijerinka a
Department of Condensed Matter, Debye Institute, 3508 TA Utrecht, The Netherlands Radiation Technology Group, Interfaculty Reactor Institute, 2629 JB Delft, The Netherlands
b
The influence of exchange interaction between paramagnetic ions on the luminescence properties is investigated for Mn2⫹-Mn2⫹, Cr3⫹-Cr3⫹, Cr3⫹-Gd3⫹, and Mn2⫹-Gd3⫹ pairs. Two effects are reported: shortening of the lifetime of the spin-forbidden emission and a shift of emission lines or bands to a longer wavelength. The shortening of the lifetime of the spin-forbidden emission is important in Mn2⫹ doped phosphors. For application of Mn2⫹-doped phosphors in displays the long lifetime of the Mn2⫹ emission is a problem. Shortening of the lifetime is possible by exchange coupling with Mn2⫹ neighbors, or possibly other paramagnetic neighbors. The results reported here show that the lifetime shortening depends on the exchange-coupling parameter J. The strongest coupling is observed in Cr3⫹-Cr3⫹ pairs and the lifetime shortening is strong 共e.g., in LaAlO3 :Cr3⫹ J ⫽ 63 cm⫺1 and the lifetime is about 30 times shorter for the pair emission兲. The coupling in Mn2⫹-Mn2⫹ and Cr3⫹-Gd3⫹ pairs is weak. Typically, values for J are around 1 cm⫺1 and the lifetime is reduced by a factor of 2-10 共e.g., J is ⫺1.0 cm⫺1 for exchange coupling between Cr3⫹ and Gd3⫹; the lifetime of the spin-forbidden Cr3⫹ emission is 14 ms in GdAlO3 compared to 56 ms in LaAlO3兲. The lifetime shortening for the Mn2⫹ emission is not related to the observed red shift for the pair emission. For the Mn2⫹-Gd3⫹ pair the exchange interaction is very weak and no significant lifetime shortening could be measured for Gd3⫹-Mn2⫹ pairs 共24 ms for the Mn2⫹ emission in YF3 vs. 22 ms in GdF3兲. © 2001 The Electrochemical Society. 关DOI: 10.1149/1.1375169兴 All rights reserved. Manuscript submitted May 15, 2000; revised manuscript received March 5, 2001. Available electronically June 6, 2001.
The luminescence properties of pairs of ions can be different from the luminescence properties of single ions, for example, due to energy transfer processes within the pair1,2 or pair interactions, which shift the positions of energy levels.3,4 Research on the luminescence properties for ion pairs is not only interesting from a fundamental point of view. Some applications rely on the interactions within pairs of optically active ions. A recent example is the possibility of quantum cutting through down conversion which is based on energy transfer processes within a pair of Gd3⫹-Eu3⫹ ions.5 Another issue is the long lifetime of the spin-forbidden emission from Mn2⫹. For some applications, the long lifetime of the Mn2⫹ emission is prohibitive.6 However, due to magnetic interactions in pairs of Mn2⫹ ions, the spin selection rule can be relaxed resulting in lifetime shortening.7-9 In this paper, various luminescent properties of exchange coupled paramagnetic ions are studied. Luminescent materials based on the luminescence of Mn2⫹ have a long history. In the first generation of commercial fluorescent lamps, 共Zn,Be兲2SiO4 :Mn2⫹ was used. In 1948, calcium halophosphate activated with Sb3⫹ and Mn2⫹ was discovered.10 For decades, this material has been applied as a phosphor in fluorescent lamps until lanthanide-doped phosphors have 共partly兲 replaced calcium halophosphate because of the higher efficiency and stability. In recent years, the interest in the well-known green-emitting Zn2SiO4 :Mn2⫹ phosphor 共willemite兲 has revived because of the potential application in plasma display panels 共PDPs兲. Zn2SiO4 :Mn2⫹ is an efficient luminescent material under vacuum ultraviolet 共VUV兲 excitation which is generated in the xenon plasma of a PDP. The luminescence of Mn2⫹ is due to a spin-forbidden transition within the 3d5 configuration of the Mn2⫹ ion. Because of the forbidden character of the transition, the lifetime of the Mn2⫹ emission is long, typically 10 ms. In lighting applications, this long lifetime is not a problem but in displays the long lifetime results in an observable afterglow. To prevent this afterglow, some recent studies have investigated the shortening of the life time of the Mn2⫹ emission by increasing the concentration of Mn2⫹ ions.8,9 A qualitative study on the influence of the Mn2⫹ concentration on the lifetime of the Mn2⫹ emission was reported by Barthou et al.8 Zn2SiO4 :Mn2⫹ samples were studied in which the Mn2⫹ con-
z
E-mail:
[email protected]
centration 共relative to Zn2⫹兲 was varied between 0.05 and 12.5 mol %. Luminescence measurements showed a shift of the emission wavelength from 519 to 526 nm upon increasing the concentration. Lifetime measurements revealed a long lived emission at low concentrations ( ⫽ 15 ms). With increasing concentrations, the lifetime decreases and the lifetime measurements show a nonexponential decay behavior. At the highest concentrations, a single exponential decay time of 1.8 ms is reached. Based on the results it was concluded that the shortening of the lifetime was not the result of concentration quenching, but rather the effect of magnetic interactions between Mn2⫹ neighbors. A more quantitative explanation was presented by Ronda and Amrein who showed that exchange interaction between Mn2⫹ ion can be responsible for a red shift of the Mn2⫹ emission and a shortening of the luminescence lifetime.9 It was suggested that the shortening of the lifetime is only observed at room temperature.9 This is remarkable since also at low temperatures exchange coupling is expected to relax the spin selection rule resulting in lifetime shortening at low temperatures. In this paper the concentration dependence of the luminescence of Mn2⫹ in other host lattices than Zn2SiO4 is reported. Luminescence and lifetime measurements for Mn2⫹ in MgAl2O4 and ZnGa2O4 are performed as a function of Mn2⫹ concentration. In the different host lattices, the distance between Mn2⫹ neighbors in pairs of ions is different. From the results, insight can be obtained in the influence of magnetic coupling between Mn2⫹ ions on the luminescence lifetime and shift in emission wavelength. In the case of Mn2⫹, the broad emission bands of single ions and pairs of ions have a large overlap and cannot be spectrally resolved. The 2E → 4 A2 emission of Cr3⫹ is a sharp line and emission from single ions and Cr3⫹ pairs can be spectrally resolved. The 2E → 4 A2 emission within the 3d3 configuration of Cr3⫹ is spinforbidden, just as is the 4T1 → 6 A1 emission for Mn2⫹. The line emission for Cr3⫹ pairs is shifted to longer wavelengths. For Cr3⫹ the influence of magnetic coupling in the pairs can be probed by selectively measuring the lifetime for the pair emission line. Results are reported for exchange coupled Cr3⫹ pairs in LaAlO3. Due to the stronger exchange coupling in Cr3⫹ pairs, the influence on the luminescence lifetime is stronger for the Cr3⫹ pair emission than for the Mn2⫹ pair emission. A potential problem in the case of lifetime shortening by increasing the Mn2⫹ 共or Cr3⫹兲 concentration is concentration quenching.
Downloaded 27 Oct 2011 to 128.178.48.29. Redistribution subject to ECS license or copyright; see http://www.ecsdl.org/terms_use.jsp
E314
Journal of The Electrochemical Society, 148 共7兲 E313-E320 共2001兲
This problem can be avoided if coupling with a different type of paramagnetic ion, which does not quench the Mn2⫹ 共or Cr3⫹兲 emission, and can be used to lift the spin-selection rule. A possible candidate is the lanthanide ion Gd3⫹共4f7兲 which has a large magnetic spin moment (S ⫽ 7/2). For both the 2E → 4 A2 emission of Cr3⫹ and the 4T1 → 6 A1 emission of Mn2⫹ the influence of coupling with nearest Gd3⫹ neighbors on the luminescence lifetime is investigated. Theory Two paramagnetic transition metal ions which are close 共typical distance of a few angstroms兲 show magnetic interaction. The Heisenberg Hamiltonian, H AB , describing the spin interaction between two transition metal ions A and B, is shown in Eq. 19 H AB ⫽ ⫺ J 共 S AS B兲 ⫹ j 共 S AS B兲 2
关1兴
In theory, this exchange interaction can occur for both the 3dn and 4f n transition metal ion pairs. Because the electrons of the 4f n lanthanides are shielded from their surrounding by the filled 5s and 5p orbitals, the interaction is much weaker for pairs of lanthanide ions. The interaction between 4f n and 3dn transition metal ion pairs is expected to be in between and is investigated in this paper. The second term of Eq. 1 usually is very small and when this term is neglected, the energy values associated with H AB can be determined, which is shown in Eq. 210 E 共 S 兲 ⫽ ⫺ J 关 S 共 S ⫹ 1兲 ⫺ S A共 S A ⫹ 1兲 ⫺ S B共 S B ⫹ 1兲兴
关2兴
From Eq. 2, it can be observed that the energy is dependent on the total spin, S, and on the exchange coupling strength parameter J. The S can take all integer values between the sum and difference of the values of S A and S B. States with different values for S are at different energies. As an example, the pair splitting of Mn2⫹ is discussed here. The ground state of Mn2⫹共3d5兲 is 6A1 (S ⫽ 5/2) and first excited state 4T1 (S ⫽ 3/2). When both ions are in the ground state, 6A1, both spins have the same value: S A ⫽ S B ⫽ 5/2. Therefore, the values of S for the exchange coupled pair can be: (S A ⫹ S B), ..., (S A ⫺ S B), so S ⫽ 5, 4, 3, 2, 1, 0. When one of the Mn2⫹ ions is in the first excited state, 4T1, and the other ion is in the ground state, 6A1, the total S value can be S ⫽ 4, 3, 2, and 1. The sign of J in Eq. 2 is determined by the type of magnetic interaction, J ⬎ 0 for a ferromagnetic and J ⬍ 0 for an antiferromagnetic interaction.10 As an example for the splitting pattern for a Mn2⫹ pair with both ions in the ground state and one ion in the excited state, the interaction has been taken as an antiferromagnetic interaction for both the 6A16A1 ground state and the 6A14T1 excited state 共Fig. 1兲. The value of J is dependent on the distance between ions in the pairs. Emissions originating from the pairs can be ascribed to transitions from the lowest excited spin state to different spin components of the ground state. Transitions where ⌬S ⫽ 0 are spin allowed.10 From Fig. 1, it can be observed that there are always transitions present, where ⌬S ⫽ 0. The influence of the crystal field on the position of the energy levels for the 3d5 transition metal ion Mn2⫹ is given in the TanabeSugano diagram for 3d5. A Tanabe-Sugano diagram for Mn2⫹ in the high spin state 共low crystal fields, 6A1 ground state兲 is shown in Fig. 2. Experimental Synthesis.—The XAlO3 :Cr3⫹ (X:La3⫹, Gd3⫹ and La3⫹/Gd3⫹兲 lattices were synthesized using usual solid-state techniques. The starting materials which were used are NH4Al共SO4兲2•12H2O, X2O3, and Cr2O3. They were milled for 30 min in a planetary ball mill and fired in a tube furnace in a N2 atmosphere for 3 h at 1000°C and 5 h at 1500°C. The Mn2⫹-doped MgAl2O4 was synthesized by mixing
Figure 1. Schematic representation of the splitting for energy levels in 6 A1 ⫺ 6 A1 ground state and 6A1 ⫺ 4 T1 state resulting from exchange coupling for antiferromagnetic exchange-coupled Mn2⫹ pairs. The vertical dotted line shows the spin allowed 1 → 1 transition (⌬S ⫽ 0).
Al2O3, MgO, and MnCO3, and firing the mixture for 4 h in a N2 /H2 atmosphere 共75/25兲 at 1350°C. ZnGa2O4 :Mn2⫹ was synthesized taking Ga2O3, ZnO, and MnCO3 as starting materials and firing the mixed starting materials in a reducing atmosphere (N2 /H2, ratio 75/25%兲, first for 3 h at 1000°C and later for 5 h at 1200°C. The Mn2⫹-doped YF3 and GdF3 were synthesized using a high frequency furnace. In the furnace, the starting materials YF3, GdF3, and MnF2 were in a glassy carbon crucible, which was placed in a quartz tube. The tube was first flushed with nitrogen. After heating to about 540°C, the system was flushed with SF6 and then, again in a nitrogen atmosphere, heated until the melting point at about 1400°C. The samples were slowly 共in about 4 h兲 cooled down to room temperature. A polycrystalline powder was obtained after grinding. All samples were found to be single phase, when checked with X-ray powder diffraction on a Philips PW 1729 X-ray generator, using Cu K␣ radiation. Luminescence and time resolved measurements.—The luminescence measurements for LaAlO3 :Cr3⫹ were performed using a Spex Fluorolog spectrofluorometer equipped with two double grating 0.22 m SPEX 1680 monochromators and a 450 W Xenon lamp as excitation source. The excitation wavelength was at 408 nm 共exciting in the 4A2 → 4 T1 spin-allowed absorption兲 The emission was detected with a cooled Hamamatsu R928 photomultiplier. The time resolved measurements for the Cr3⫹-doped aluminates were performed on a frequency doubled Quanta Ray Nd:yttrium-aluminum-garnet 共YAG兲 laser. The excitation wavelength was at 532 nm 共exciting in the 4 A2 → 4 T2 spin-allowed absorption兲. The emission spectra were measured by a Spex 1269 monochromator 共1.26 m兲 and light was detected with a cooled Hamamatsu R928 photomultiplier. The decay curves were taken using a Tectronix 2430 digital oscilloscope. The low temperature measurements were done using an Oxford Instruments liquid helium flow cryostat.
Downloaded 27 Oct 2011 to 128.178.48.29. Redistribution subject to ECS license or copyright; see http://www.ecsdl.org/terms_use.jsp
Journal of The Electrochemical Society, 148 共7兲 E313-E320 共2001兲
E315
Figure 3. Emission spectra ( exc ⫽ 308 nm, T ⫽ 298 K兲 of Mn2⫹-doped MgAl2O4 for different Mn2⫹ concentrations 共0.2, 2, and 5 mol %兲.
Figure 2. Tanabe-Sugano diagram of a 3d5 transition metal ion.
The emission spectra for the Mn2⫹-doped spinel samples were measured on the Nd:YAG-laser described above using the Quanta Ray PDL-2 DyeLaser with a sulforhodamine dye 共range: 603-625 nm兲. The light of 612 nm was frequency doubled with a Quanta Ray WEX-1 wavelength extender to an excitation wavelength of 306 nm. The emission was detected by an ARC Spectro Pro-300i monochromator 共length: 0.3 m兲 and a Princeton Instruments charge coupled device 共CCD兲 camera. Lifetime measurements for the Mn2⫹-doped spinel samples were performed using a Lambda Physik LPX-100 XeCl-excimer laser for excitation at a wavelength of 308 nm. The samples were cooled with an Oxford Instruments liquid helium flow cryostat. The emission was spectrally resolved with a Jobin-Yvon 1 m monochromator and detected with a cooled Hamamatsu R928 photomultiplier. The decay curves were measured using a Tectronix 2440 digital oscilloscope. The luminescence measurements for the Mn2⫹-doped YF3 and GdF3 samples were performed on the Spex Fluorolog setup described above, whereas the time resolved measurement were done using the Nd:YAG laser setup described above using an excitation wavelength of 355 nm 共third harmonic of the 1064 nm wavelength兲. The emission was collected using the monochromator with the CCD camera described above. For lifetime measurements an RCA C31034 photomultiplier tube, on the other port of the monochromator, was used and the decay curves were recorded with a Tectronix 2440 digital oscilloscope.
tions ascribed to transitions within the 3d5 configuration of Mn2⫹ 共all spin-forbidden兲 and a strong charge transfer band around 308 nm. Upon increasing the Mn2⫹ concentration, the position of the Mn2⫹ emission shifts to longer wavelengths. For the sample with highest Mn2⫹ concentration 共10 mol %兲 the emission band has shifted to 528.3 nm. In Fig. 4, the position of the Mn2⫹ emission 共left axis兲 is plotted as a function of the Mn2⫹ concentration. To investigate if pair formation at higher Mn2⫹ concentrations gives rise to a shortening of the lifetime of the Mn2⫹ emission, the lifetime of the Mn2⫹ emission was measured as a function of the Mn2⫹ concentration. In Fig. 5, decay curves of the Mn2⫹ emission are plotted. For the lowest Mn2⫹ concentration, the emission shows a single exponential decay behavior with a lifetime of 7.2 ms. At higher concentrations, the decay becomes nonexponential and faster. Lifetimes were determined by fitting the experimentally observed luminescence decay between 2 and 20 ms to a single exponential function. The decrease of lifetime at increasing Mn2⫹ concentration is shown in Fig. 4. The lifetime of the Mn2⫹ emission decreases as a function of the Mn2⫹ concentration from 7.2 ms for the sample with 0.2 mol % of Mn2⫹ to 4.5 ms for the sample doped with 10 mol %. The shortening of the lifetime can be explained by magnetic interactions 共exchange coupling兲. To exclude a contribution from concentration quenching to the shortening of the luminescence life-
Results and Discussion Luminescence of Mn2⫹ pairs.—Luminescence spectra for Mn2⫹ in MgAl2O4 for different Mn2⫹ concentrations 共0.2, 2, and 5 mol % of Mn2⫹兲 are shown in Fig. 3. For the lowest Mn2⫹ concentration the emission has a maximum at 518.8 nm. The position of the emission band is in agreement with values reported in literature11 and the emission can be assigned to the 4T1 → 6 A1 transition on Mn2⫹. The excitation spectrum 共not shown here兲 shows different weak absorp-
Figure 4. Peak position 共nm兲 and decay time 共ms兲 of the Mn2⫹ emission as a function of the Mn2⫹ concentration in MgAl2O4 :Mn2⫹.
Downloaded 27 Oct 2011 to 128.178.48.29. Redistribution subject to ECS license or copyright; see http://www.ecsdl.org/terms_use.jsp
E316
Journal of The Electrochemical Society, 148 共7兲 E313-E320 共2001兲
Figure 5. Decay curves (T ⫽ 298 K兲 of Mn2⫹-doped MgAl2O4 共0.2, 2, and 5 mol %兲 showing a decrease of radiative lifetime at increasing Mn2⫹ concentration.
time, the light output was measured as a function of the Mn2⫹ concentration. Up to 5 mol % Mn2⫹ the light output increases linearly with the Mn2⫹ concentration, indicating that concentration quenching does not contribute to the observed lifetime shortening in this concentration range. At low Mn2⫹ concentrations, the decay curves show a single exponential decay since there is only one type of luminescent center 共single Mn2⫹ ions兲. At higher concentrations, the decay becomes slightly nonexponential due to the fact that now also emission from Mn2⫹ pairs occurs which has a shorter lifetime. The lifetimes reported here are obtained by fitting a nonexponential decay curve to a single exponential function in the time regime between 2 and 20 ms. This procedure gives an average lifetime. Due to the presence of different types of Mn2⫹ pairs 共e.g., nearest and next nearest neighbors兲 and some single step energy transfer from isolated Mn2⫹ ions to Mn2⫹ pairs, there is a range of lifetimes and it is not possible to fit the decay curves to a simple biexponential assuming only single ions and ion pairs are present. In Ref. 8, the nonexponential decay curves of the Mn2⫹ in Zn2SiO4 :Mn2⫹ were fitted to the Yokota-Tanimoto model for luminescence decay in the presence of diffusion limited energy migration to traps. Good fits were obtained and information was derived from the fit parameters. Although it seems to be more correct to fit the nonexponential decay curves to a model which can describe an observed nonexponential decay behavior, we think that in the case of the emission from Mn2⫹ in MgAl2O4 共and also Zn2SiO4兲, the Yokota-Tanimoto model is not valid. The model describes the luminescence decay of donor ions in the case of 共isotropic兲 diffusion limited energy migration to 共deep兲 traps.12 The Mn2⫹ pairs can indeed act as traps, but due to the strong overlap between the emission from pairs and single ions, the luminescence decay curves represent the decay for both the single ions and pairs of ions 共i.e., donors and traps兲. Therefore, the Yokota-Tanimoto model cannot be applied to this situation. Also, the energy migration will be anisotropic since the donors do not occupy all lattice sites 共the Mn2⫹ concentration is not 100%兲 and the donors are randomly distributed over the lattice sites. Finally, the traps are not only populated by energy transfer to traps, but also by direct excitation 共the excitation spectra of the single ions and pairs are very similar兲. For this situation, the Yokota-Tanimoto model, or any other model which describes the donor or acceptor decay in the presence of direct energy transfer 共like Inokuti-Hirayama兲 and/or energy transfer via energy migration 共like the models developed by Burshtein or Huber兲, cannot be applied.12,13
Figure 6. Excitation spectra 共left side, em ⫽ 501 nm for 1 mol % and 503 nm for 5 mol %兲 and emission spectra 共right side, exc ⫽ 287 nm兲 of ZnGa2O4-doped with 1 and 5 mol % Mn2⫹ measured at T ⫽ 4 K.
The values for the lifetime derived from the fit to a single exponential decay is, although unsatisfactory, the best indication for the shortening of the lifetime due to exchange interaction. The observed decrease from 7.2 to 4.5 ms is less than observed for Mn2⫹ in Zn2SiO4 where the lifetime decreases from 15 to 1.8 ms. This can be explained by a smaller exchange coupling between the Mn2⫹ ions in MgAl2O4. This is probably due to the larger Mn-Mn distance in nearest neighbor 共NN兲 pairs of MgAl2O4. The Mn-Mn distances in Mn2⫹-doped Zn2SiO4 are 3.30 Å,14 whereas Mn-Mn distances in Mn2⫹-doped spinels are much larger (MgAl2O4 :5.71 Å and ZnGa2O4 :5.90 Å. 15 The red shift of the emission from 518.8 nm at low concentrations to 528.3 nm for 10% Mn2⫹ is 350 cm⫺1, which is slightly larger than the red shift reported for Mn2⫹ in Zn2SiO4 共250 cm⫺1兲. The red shift of the Mn2⫹ emission as a function of concentration can be explained by a difference in exchange coupling for both ions in the ground state and for the situation where one ion is in the excited state.9 Apparently, this difference in exchange coupling is somewhat larger for Mn2⫹ pairs in MgAl2O4. The concentration dependence of the Mn2⫹ emission in ZnGa2O4 was investigated by measuring luminescence spectra and luminescence decay curves for samples with 0.1, 1, and 5 mol % Mn2⫹. The low temperature excitation and emission spectra for 1 and 5 mol % Mn2⫹ are shown in Fig. 6. No evidence for concentration quenching is found in the concentration regime up to 5 mol % of Mn2⫹. The emission spectra show a zero phonon line at 501 nm and vibronic lines at longer wavelengths, in agreement with previous publications.16,17 Both the zero phonon line and the vibronic lines have shifted to slightly longer wavelengths for the sample with 5 mol % Mn2⫹. The red shift is about 75 cm⫺1. The luminescence decay curves, shown in Fig. 7, are nonexponential, even for the lowest Mn2⫹ concentrations. Probably, this is due to energy transfer to defects. Also in previous publications, a faster initial decay has been observed in the luminescence decay curves of the Mn2⫹ emission in ZnGa2O4 at low Mn2⫹ concentrations.16,17 The luminescence lifetime derived from the tail of the decay curves (t ⬎ 5 ms) is 7 ms for the sample with 0.1 mol % Mn2⫹ and 4 ms for the sample with 5 mol % Mn2⫹. The results presented above show that the shortening of the lifetime as a result of exchange coupling between Mn2⫹ occurs in both MgAl2O4 and ZnGa2O4. The reduction in lifetime is smaller than what has been reported for Mn2⫹ in Zn2SiO4. This is probably due
Downloaded 27 Oct 2011 to 128.178.48.29. Redistribution subject to ECS license or copyright; see http://www.ecsdl.org/terms_use.jsp
Journal of The Electrochemical Society, 148 共7兲 E313-E320 共2001兲
Figure 7. Decay curves of the Mn2⫹ emission for ZnGa2O4 :Mn2⫹ for two concentrations: 共⫹兲 0.1 mol % Mn2⫹, and 共⫻兲 5.0 mol % Mn2⫹. exc ⫽ 308 nm and em is 500 nm 共0.1 mol %兲 or 503 nm 共5 mol %兲. The temperature is 4 K.
to smaller exchange interaction between Mn2⫹ ions in MgAl2O4 and ZnGa2O4 due to a larger distance between nearest Mn2⫹ neighbors. The shorter lifetime for the Mn2⫹ pairs is also observed at low temperatures. The red shift of the Mn2⫹ emission is not related to the change in lifetime. The largest change in lifetime is found in Zn2SiO4 :Mn2⫹ 共 from 15 to 1.8 ms兲 with a red shift of about 250 cm⫺1.8,9 For the Mn2⫹ emission in MgAl2O4 and ZnGa2O4, the lifetime is reduced from about 7 ms to 4 ms in both host lattices while the red shift of the Mn2⫹ emission is larger 共350 cm⫺1 in MgAl2O4兲 or smaller 共75 cm⫺1 in ZnGa2O4兲 than the red shift reported for Mn2⫹ in Zn2SiO4 共250 cm⫺1兲. This result is consistent with the model presented by Ronda and Amrein: the shortening of the lifetime is due to exchange interaction, while the red shift of the emission results from a difference in the exchange interaction in a pair of ions both in the ground state and one in the ground state and one in the excited state.9 Luminescence of Cr3⫹ pairs.—The magnetic coupling between Cr ions is stronger than between Mn2⫹ ions. Typical values for J for exchange coupled Mn2⫹ pairs are below 5 cm⫺1,18 while for Cr3⫹, values around 50 cm⫺1 are commonly observed.19 Based on the stronger exchange coupling, a stronger reduction of the luminescence lifetime can be expected for pairs of Cr3⫹ ions. In Fig. 8, emission spectra of LaAlO3 doped with 0.1, 0.5, 1.0, and 2.0 mol % of Cr3⫹ are shown. For the lowest concentration, a sharp 2E → 4 A2 emission line is observed around 735 nm. This emission from single Cr3⫹ ions is known as the R-line emission. In a higher resolution spectrum 共not shown here兲 it can be observed that the R-line emission is split in a R1 and a R2 line separated by 5.4 cm⫺1. On the longer wavelength side, weak vibronic lines are observed. The present results are in agreement with earlier reports on the luminescence of Cr3⫹ in LaAlO3. 20 When the Cr3⫹ concentration is raised, new emission lines appear in the emission spectrum. These lines can be attributed to emission from Cr3⫹ pairs. As can be expected for pair lines, the relative intensity of the pair emission lines strongly increases with increasing Cr3⫹ concentration. In Table I, the positions of the various emission lines are tabulated. In addition to the emission lines from the single ions 共zero phonon line and vibronics兲 pair lines are observed 共peaks 5, 8, and 11兲, which can be assigned to an antiferromagnetically coupled nearest neighbor 共NN兲 pair of Cr3⫹ ions. The strong line at 747.3 nm corresponds to the 2 → 2 transition and, at higher and lower energy, the 2 → 1 and 2 → 3 lines are observed. From the positions of the emission lines and with Eq. 2, 3⫹
E317
Figure 8. Emission spectra of LaAlO3 :Cr3⫹ ( exc ⫽ 408 nm, T ⫽ 4 K兲 for different Cr3⫹ concentrations 共0.1, 0.5, 1, and 2 mol %兲. The emission spectra are scaled to the intensity of the R-line.14
the value for J can be estimated to about ⫺63 cm⫺1. These observations are in good agreement with previous results on LaAlO3 :Cr3⫹, where a value of ⫺66.6 cm⫺1 was calculated for the antiferromagnetically coupled nearest Cr3⫹ neighbors in LaAlO3. 20 The emission lines at 752.1, 745.4, and 734.4 nm have not previously been identified. The positions fit the spectral positions expected for a ferromagnetically coupled Cr3⫹ pairs with J ⫽ 64 cm⫺1. Since ferromagnetic interaction is predicted for next nearest neighbor 共NNN兲 Cr3⫹ pairs in LaAlO3, 20 the emission lines can probably be attributed to emission from NNN Cr3⫹ pairs. In Fig. 9, the luminescence decay curves are shown for the single Cr3⫹ ions 共R-line emission兲 and the pair emission lines. The lifetime of the emission of the single ions is long ( ⫽ 56 ms at room temperature, 81 ms at T ⫽ 4 K1兲. The long lifetime of the Cr3⫹ emission is due to a combination of the spin-selection rule and the parity selection rule 共in inversion symmetry the transition within the 3d3 configuration is parity forbidden兲. For the Cr3⫹ pairs, the emission lifetime is much shorter, around 2 ms. The shortening of the decay time can be explained by a partial lifting of the spin-selection rule. For the exchange coupled Cr3⫹ pair, the 2 → 2 and 1 → 1 transitions are formally spin allowed which results in a shortening of the lifetime of the emission from Cr3⫹ pairs similar to the observation for Mn2⫹ pairs described above. The stronger exchange cou-
Table I. Assignment of the emission peaks observed for LaAlO3 :Cr3¿ „2 mol %, T ⫽ 4 K, w: weak, m: moderate, s: strong intensity….
Peak
em 共nm兲
¯v experimental 共cm⫺1兲
Assignment
¯v literature 共cm⫺1兲20
1w 2w 3w 4m 5m 6w 7s 8s 9m 10 m 11 w 12 w 13 m 14 s
792 779.2 776.8 770.3 758.2 755.4 752.1 747.3 745.4 745.2 740.5 737.2 734.4 733.5
12626 12834 12873 12982 13189 13238 13296 13382 13418 13419 13504 13565 13617 13633
Vibronic Pair line vibronic R-line vibronic R-line vibronic 2→3共NN兲 R-line vibronic 1→1共NNN兲 2→2 共NN兲 1→2 共NNN兲 R-line vibronic 2→1 共NN兲 1→1 共NN兲 1→3 共NNN兲 R 1 ⫹ R 2 -lines
12823 12860 12973 13172 13223 13369 13507 13562 13625
Downloaded 27 Oct 2011 to 128.178.48.29. Redistribution subject to ECS license or copyright; see http://www.ecsdl.org/terms_use.jsp
E318
Journal of The Electrochemical Society, 148 共7兲 E313-E320 共2001兲
Figure 9. Decay curves for single ion emission (R1-line, em ⫽ 733.5 nm兲, nearest neighbor pair (2 → 2, em ⫽ 747.3 nm兲 and next nearest neighbor pair (1 → 1, em ⫽ 752.1 nm兲 emission for Cr3⫹ in LaAlO3 :Cr3⫹ 共2 mol %兲, exc ⫽ 532 nm and T ⫽ 7 K. The time scale for the single ion emission (R1) should be multiplied by a factor of 10 共i.e., the decay shown is the decay between 0 and 60 ms兲.
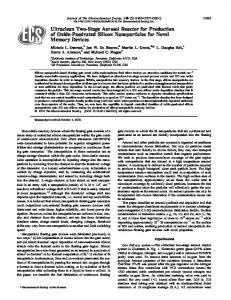
pling between Cr3⫹ ions can explain the observation that the influence of the exchange coupling on the decay time is larger for the Cr3⫹ pairs than for the Mn2⫹ pairs. In addition, a distortion of the inversion symmetry by replacing a NN 共or NNN兲 Al3⫹ ion by Cr3⫹ can also lead to a shortening of the decay time for Cr3⫹ pairs. A deviation from inversion symmetry will allow for the admixture of opposite parity states in the 3d3 states as a result of the presence of odd parity crystal field components. Due to the admixture, the 2E → 4 A2 transition will become partially electric dipole allowed. It is not possible to separate or estimate the contribution of the lifting of the spin and parity selection rule on the lifetime shortening in Cr3⫹ pairs. Luminescence of Cr3⫹-Gd3⫹ and Mn2⫹-Gd3⫹ pairs.—In the previous two sections, the shortening of the luminescence lifetime of spin-forbidden transitions by magnetic coupling between paramagnetic ions of the same type was described. It is interesting to investigate if exchange coupling between Cr3⫹ or Mn2⫹ with a different type of paramagnetic ion can also result in a shortening of the lifetime. Lifetime shortening due to concentration quenching is avoided if exchange coupling with a different type of paramagnetic ion occurs. Especially for Mn2⫹, it is interesting to investigate if the problem of the long luminescence lifetime can be solved by exchange coupling with a different type of paramagnetic ion which does not quench the Mn2⫹ emission. An obvious candidate for magnetic interaction is Gd3⫹共4f 7兲. The lanthanide ion Gd3⫹ has a large magnetic spin moment (S ⫽ 7/2) and the energy gap between the ground state ( 8 S 7/2) and the first excited state ( 6 P 7/2) is large, 32,000 cm⫺1. The high energy position of the first excited state prevents energy transfer from Mn2⫹ or Cr3⫹ to Gd3⫹ and no shortening of the lifetime by energy transfer is possible. To investigate the influence of magnetic coupling in pairs of Cr3⫹ or Mn2⫹ and Gd3⫹ isostructural compounds of Gd3⫹ 共paramagnetic兲 and Y3⫹ or La3⫹ 共diamagnetic兲 doped with Cr3⫹ or Mn2⫹ were synthesized and the lifetime of the spin-forbidden emission from the 3dn transition metal ion was measured. In the past, some work has been done on the magnetic coupling between Cr3⫹ and Gd3⫹ in GdAlO3. 20,21 The line shape of the 2E → 4 A2 transition could be explained by magnetic coupling between Gd3⫹ and Cr3⫹. The coupling constant, J, was calculated to be 1 cm⫺1 for Cr3⫹ in the 4A2 ground state and 0.55 cm⫺1 for Cr3⫹ in the 2E excited state.20 These values are of the same order of magnitude as values
Figure 10. Decay curves of the 2E → 4 A2 emission for Cr3⫹ in LaAlO3 ( em ⫽ 735 nm), La0.94Gd0.06AlO3 ( em ⫽ 735 nm) and GdAlO3 ( em ⫽ 727 nm) measured for exc ⫽ 532 nm at room temperature.
reported for the exchange interaction in Mn2⫹ ion pairs. To study the influence of magnetic coupling on the spin selection rule, LaAlO3 and GdAlO3 doped with 0.05% of Cr3⫹ were investigated. Both GdAlO3 and LaAlO3 have a 共slightly different兲 perovskite-like structure in which the Cr3⫹ ion, which substitutes for an Al3⫹ ion, is in a center of inversion symmetry. The emission spectra of Cr3⫹-doped LaAlO3 and GdAlO3 are quite similar. The 2E → 4 A2 emission is at slightly shorter wavelength for Cr3⫹ in GdAlO3 共727 nm vs. 735 nm in LaAlO3兲 indicating that the Racah parameter, B, is somewhat larger for Cr3⫹ in GdAlO3. In Fig. 10, the luminescence decay curves are plotted for the Cr3⫹ 2E → 4 A2 共single ion兲 emission in LaAlO3, La0.94Gd0.06AlO3, and GdAlO3. It is clearly observed that the decay of the emission is faster for Cr3⫹ in GdAlO3. Fits of the observed decay behavior to a single exponential function gives a lifetime of 56 ms for Cr3⫹ in LaAlO3 and 14 ms for Cr3⫹ in GdAlO3. The shortening of the lifetime can be explained by lifting of the spin-selection rule by magnetic coupling between Cr3⫹ and Gd3⫹. The order of magnitude of the shortening 共a factor of four兲 is similar to what is observed for exchange coupled pairs of Mn2⫹ ions reported in the Results and Discussion section on Luminescence of Mn2⫹ pairs. For Cr3⫹ pairs, a stronger reduction of the lifetime is observed 共the Results and Discussion section on Luminescence of Cr3⫹ pairs兲. This can be understood qualitatively. Due to the stronger magnetic coupling between Cr3⫹ neighbors 共J around 50 cm⫺1兲, the spin selection rule is lifted to a larger extent than for Gd3⫹-Cr3⫹ or Mn2⫹-Mn2⫹ pairs 共J below 5 cm⫺1兲 and the lifetime shortening is more pronounced. The weaker coupling in the Gd3⫹-Cr3⫹ pair compared to the Cr3⫹-Cr3⫹ pair is due to the shielding of the 4f7 electrons in Gd3⫹ by the filled 5s2 and 5p6 shells. Due to the shielding, the interaction between the 4f n configuration of lanthanides with the environment is weak. Due to the weak coupling of the 4f n configuration of lanthanides, the magnetic coupling in pairs of lanthanides is very weak. For example, in GdAlO3 the exchange interaction parameter J is only ⫺0.05 cm⫺1 for the antiferromagnetic interaction between nearest Gd3⫹ neighbors.21 The significant shortening of the lifetime of the Cr3⫹ emission by magnetic interaction with Gd3⫹ neighbors indicates that it may be possible to shorten the Mn2⫹ lifetime by coupling with Gd3⫹ neighbors. On the other hand, the weaker interaction between Mn2⫹ neighbors in comparison to Cr3⫹ neighbors indicates that the magnetic coupling with Gd3⫹ neighbors may be smaller for Mn2⫹ than for Cr3⫹, resulting in a small or negligible effect on the luminescence lifetime of the spin-forbidden Mn2⫹ emission. We are not
Downloaded 27 Oct 2011 to 128.178.48.29. Redistribution subject to ECS license or copyright; see http://www.ecsdl.org/terms_use.jsp
Journal of The Electrochemical Society, 148 共7兲 E313-E320 共2001兲
E319
Figure 12. Luminescence decay time curves for Mn2⫹-doped GdF3 and YF3. Both curves were measured at T ⫽ 298 K using exc ⫽ 355 nm and em ⫽ 523 nm.
agreement with the value of 21 ms reported by Poort.22 The small difference in decay time between Mn2⫹-doped YF3 and GdF3 may be due to magnetic interactions but may also be due to other factors. Clearly, the influence of magnetic interactions between Mn2⫹ and Gd3⫹ on the luminescence lifetime of the Mn2⫹ emission is small or absent. This shows that the exchange coupling between Gd3⫹ and Mn2⫹ is small; J is probably smaller than 0.1 cm⫺1. As a result of the weak coupling, lifetime shortening of the long lived Mn2⫹ emission by magnetic coupling with Gd3⫹ ions does not seem a promising route to solve the problem of the long lifetime of the green Mn2⫹ emission in display applications. Figure 11. Excitation spectra 共solid lines兲 and emission spectra 共dotted lines兲 of 共A兲 YF3 :Mn2⫹, em ⫽ 522 nm and exc ⫽ 335 nm, and 共B兲 GdF3 :Mn2⫹, em ⫽ 522 and exc ⫽ 273 nm measured at room temperature. The intensity for the excitation spectrum of GdF3 :Mn2⫹ has been multiplied between 320 and 450 nm by a factor of 100.
aware of estimates in the literature on the magnitude of the Mn2⫹-Gd3⫹ exchange interaction parameter J. To investigate the influence of the presence of nearest Gd3⫹ neighbors on the lifetime of the Mn2⫹ emission, the luminescence of Mn2⫹ was studied in YF3 and in GdF3. In Fig. 11, the excitation and emission spectra for Mn2⫹ in GdF3 and YF3 are shown. To avoid an influence of the formation of Mn2⫹ pairs, the Mn2⫹-concentration was low 共0.05 mol %兲. The excitation spectra of YF3 :Mn2⫹ shows the spin-forbidden Mn2⫹ absorptions, whereas the GdF3 :Mn2⫹ excitation spectrum is dominated by the 8S7/2 → 6 PJ ( exc ⬇ 310 nm) and 8S7/2 → 6 IJ ( exc ⬇ 275 nm) excitation lines. The emission spectra show the 4T1 → 6 A1 emission around 523 nm for Mn2⫹ in both host lattices. In both emission spectra, defect emission is present at an emission wavelength between 400 and 450 nm. Defect emission is well known for fluoride crystals and may be related to F⫺ vacancies. Possible, the concentration of F⫺ vacancies is relatively high since F⫺ vacancies can be used for charge compensation required by replacing a trivalent (Y3⫹ or Gd3⫹兲 ion by a divalent Mn2⫹ ion. In Fig. 12, the luminescence decay curves of the Mn2⫹ emission are depicted. Comparison of the two decay curves shows that the difference between the luminescence decay for the Mn2⫹ emission in YF3 :Mn2⫹ and GdF3 :Mn2⫹ is very small. Fits of the experimentally observed decay to a single exponential decay function gives a lifetime of 24 ms for the Mn2⫹ emission in YF3 :Mn2⫹ and 22 ms for Mn2⫹ in GdF3 :Mn2⫹. The value of 22 ms for GdF3 :Mn2⫹ is in good
Conclusions Luminescence spectroscopy of exchange coupled pairs of transition metal ions has been reported for different types of pairs. For Cr3⫹-Cr3⫹ pairs the exchange coupling is strong. As a result, the emission spectra are different from the single ion spectra and the lifetime of the spin-forbidden 2E emission is strongly reduced. For Mn2⫹-Mn2⫹ and Cr3⫹-Gd3⫹ pairs the exchange interaction is weaker than for Cr3⫹-Cr3⫹ pairs. Still, a shift in the emission wavelength and a shortening of the lifetime of the spin forbidden 4T1 emission 共for Mn2⫹兲 or 2E emission 共for Cr3⫹兲 is observed. For Mn2⫹-Gd3⫹ pairs, the exchange coupling is too weak to measure a significant change in the spin-forbidden Mn2⫹ emission. Acknowledgments We would like to thank M. Heeroma and J. Meijer for the lifetime measurements performed on Mn2⫹-doped MgAl2O4. References 1. 2. 3. 4. 5. 6. 7. 8. 9. 10. 11. 12. 13. 14.
H. Siebold and J. Heber, J. Lumin., 23, 325 共1981兲. J. Hegarty, D. L. Huber, and W. M. Yen, Phys. Rev. B, 25, 5638 共1982兲. T. Tsuboi, Phys. Rev. B, 29, 1022 共1984兲. J. Derkosch and W. Mikenda, J. Solid State Chem., 22, 127 共1977兲. R. T. Wegh, H. Donker, K. D. Oskam, and A. Meijerink, Science, 283, 663 共1999兲. C. R. Ronda, J. Alloys Compd., 225, 534 共1995兲. A. L. N. Stevels and A. T. Vink, J. Lumin., 8, 443 共1974兲. C. Barthou, J. Benoit, P. Bennalloul, and A. Morell, J. Electrochem. Soc., 141, 524 共1994兲. C. R. Ronda and T. Amrein, J. Lumin., 69, 245 共1996兲. B. Henderson and G. F. Imbusch, Optical Spectroscopy of Inorganic Solids, p. 475, Oxford University Press, Oxford, U.K. 共1989兲. R. Clausen and K. Petermann, J. Lumin., 40,41, 185 共1988兲. M. Yokota and O. Tanimoto, J. Phys. Soc. Jpn., 22, 779 共1967兲. B. Henderson and G. F. Imbusch, Optical Spectroscopy of Inorganic Solids, p. 445, Oxford University Press, Oxford 共1989兲. K. H. Klaska, J. C. Eck, and D. Pohl, Acta Crystallogr., 34, 3324 共1978兲.
Downloaded 27 Oct 2011 to 128.178.48.29. Redistribution subject to ECS license or copyright; see http://www.ecsdl.org/terms_use.jsp
E320
Journal of The Electrochemical Society, 148 共7兲 E313-E320 共2001兲
15. R. W. G. Wyckoff, Crystal Structures, p. 75, 2nd ed., John Wiley & Sons, New York 共1964兲. 16. S. H. M. Poort, D. Cetin, A. Meijerink, and G. Blasse, J. Electrochem. Soc., 144, 2179 共1997兲. 17. C. F. Yu and P. Lin, Jpn. J. Appl. Phys., Part 1, 35, 5726 共1996兲. 18. D. S. McClure, J. Chem. Phys., 39, 2850 共1963兲.
19. 20. 21. 22.
A. L. Shawlow, D. L. Wood, and A. M. Clogston, Phys. Rev. Lett., 3, 271 共1959兲. J. P. van der Ziel, Phys. Rev. B, 4, 2888 共1971兲. T. Kita and Y. Tanabe, J. Phys. Soc. Jpn., 54, 2293 共1985兲. S. H. M. Poort, A. Meijerink, and G. Blasse, Solid State Commun., 103, 537 共1997兲.
Downloaded 27 Oct 2011 to 128.178.48.29. Redistribution subject to ECS license or copyright; see http://www.ecsdl.org/terms_use.jsp