May 6, 2008 - A Lithography-friendly Structured ASIC Design Approach. Salman Gopalaniâ salman_at_neo.tamu.edu. Rajesh Gargâ¡ rajeshgarg_at_tamu.
A Lithography-friendly Structured ASIC Design Approach Rajesh Garg‡ rajeshgarg_at_tamu.edu Mosong Cheng‡ mcheng_at_ece.tamu.edu
Salman Gopalani∗ salman_at_neo.tamu.edu Sunil P Khatri‡ sunilkhatri_at_tamu.edu ‡
∗ National Instruments, Austin, TX 78759 Department of Electrical & Computer Engineering,Texas A&M University, College Station, TX 77843
ABSTRACT
cost over $1-3M [1, 2]. It has been argued that this change has contributed to a roughly 25% reduction [2] in application specific integrated circuit (ASIC) starts in the last 7 years. It is commonly believed that standard cell based ASICs are becoming prohibitively expensive except for very high volume applications [2]. In such a situation, it would be appealing to devise a design approach which enables a set of designs to share a majority of the fabrication masks, differing in only a small subset of masks. This would allow the foundry to amortize the cost of the shared masks over a large number of designs. Process variations can be classified into two categories: systematic variations and random variations [3, 4, 5]. The systematic component is the predictable variation trend across a chip, and is caused by spatial dependencies of device processing, such as Chemical and Mechanical Planarizations (CMP) effects and optical proximity effects. The random component is caused by effects such as random fluctuation of the number of dopants in the MOSFET channel. According to the International Technology Roadmap for Semiconductors (ITRS) [6], the systematic component of variation is a substantial fraction of the total variation. Thus, reducing the systematic component can significantly decrease the performance variability of a design and hence, can increase the yield. The variation due to optical proximity effects is a substantial component of the total systematic variations [5]. Optical proximity effects can affect the poly and metal shapes which are printed on a wafer and thus affect the circuit performance. The changes in the poly shapes directly translate into channel length variations, and this impacts the circuit performance significantly compared to the metal wire variations. Therefore, variations due to the optical proximity effects should be minimized , especially in the poly layer. An ASIC design (implemented using standard cells) is affected by optical proximity effects because of the lack of the regularity on the poly layer. Optical proximity correction (OPC) is performed to deal with proximity effects. However, it is a computationally expensive process, and performing OPC for different designs is very time consuming. Therefore, it would be advantageous to have a regular design approach which avoids the need to perform OPC for all or some of the mask layers (for example the poly layer) in a design. To address both the above issues (i.e. the increasing cost of the masks required for a design, and the systematic variations due to the optical proximity effects) it is desirable to implement different designs using regular circuit structures. These regular structures allow different designs to share most of the fabrication masks, and also reduce variations due to their layout regularity. In this paper, we introduce a new structured ASIC type VLSI design approach which utilizes array of regular 2-input NAND gates. The NAND2 logic function is functionally complete, i.e. any logic circuit can be realized using combinations of NAND2 gates only [7]. Hence, it can be used to create any design.
Integrated circuit manufacturing costs are increasing with decreasing device feature sizes, due to significant increases in mask costs. At the same time, systematic processing variations due to optical proximity effects are also increasing, making it harder to predict the circuit behavior with fidelity. Therefore, there is a need to implement designs using regular circuit structures. In this paper, we present a new structured ASIC approach which utilizes an array of 2-input NAND gates. Our NAND2 array based circuit implementation reduces manufacturing costs, and design turn-around times because different designs can share the same masks up to the poly layer. The regular layout structure of our NAND2 array also helps in reducing systematic variations. We compared the performance of our NAND2 array with the ASIC approach by implementing several benchmark circuits using both methods. The experimental results demonstrate that on average, our approach has a delay penalty of 40%, an area penalty of 12%, and a power increase of 7%, compared to an ASIC design approach. This is better than the previously reported structured ASIC approaches. We also performed lithographical simulations of the poly and metal masks of the designs implemented using our approach as well as the ASIC design approach. These lithographical simulation results demonstrate that our approach has lower errors on the poly and the Metal1 layers by 7% and 24% respectively, compared to the ASIC approach. Categories and Subject Descriptors: B.7.1 [Types and Design Styles]: Gate arrays General Terms: Design, Reliability Keywords: ASIC, OPC, Lithography
1.
INTRODUCTION
In the deep sub-micron (DSM) era, with continuously decreasing feature sizes, both the complexity of fabrication processes and the severity of process variations are increasing at an alarming rate. These issues present a critical challenge to manufacture reliable integrated circuit (IC) products economically. With the increasing complexity of manufacturing processes, the number and cost of a full set of masks also increasing rapidly. In recent times, a full set of lithography masks may
Permission to make digital or hard copies of all or part of this work for personal or classroom use is granted without fee provided that copies are not made or distributed for profit or commercial advantage and that copies bear this notice and the full citation on the first page. To copy otherwise, to republish, to post on servers or to redistribute to lists, requires prior specific permission and/or a fee. GLSVLSI’08, May 4–6, 2008, Orlando, Florida, USA. Copyright 2008 ACM 978-1-59593-999-9/08/05 ...$5.00.
315
customizing METAL and VIA masks. In [11, 12, 13], the authors propose a Field-Programmable Gate Array (FPGA) like design methodology using CLB-like logic blocks as the underlying circuit structure. In contrast, this approach uses an array of NAND2 gates to form the underlying circuit structure. Other recent structured ASIC approaches include [14] and [8]. In [14] the authors use a fixed size Programmable Logic Array (PLA) as the underlying structure to implement logic. The average delay and area overhead of this approach were 189% and 396%. Similarly, in [8], the authors utilize a Pass Transistor Logic (PTL) based circuit fabric to implement the design. The delay and area overhead of this approach were on average 101% and 508% respectively. In contrast to [14] and [8] the approach of this paper has a significantly lower overhead 40% for delay, and 12% for area compared to ASIC approach. Essentially, the approach of this paper is mask programmable, i.e. circuit functionality can be changed by using a different set of METAL and VIA masks. In this way, a good compromise between the speed of standard cell based ASICs and flexibility of FPGAs can be achieved. ASICs for 130 nm and 90 nm technology have delays per gate of 28ps and 20ps respectively, while FPGAs have gate delays of 700ps and 500ps [15] respectively. This means that ASICs are 25x faster than FPGAs, not to mention they are also 10x smaller in area. As a consequence, there is a strong motivation to develop design approaches that bridge the area and delay gap between ASICs and FPGAs. This paper attempts to bridge this gap.
The IC die would consist of an array of unconnected or unrouted NAND2 gates. A manufacturer could stock the pre-fabricated wafers in different array sizes. Note that these arrays are fabricated upto the poly layer. To create an ASIC for a given design, the manufacturer would map the design to the smallest available array of NAND2 gates. The METAL and VIA masks would be generated to customize (route) the design. A manufacturer could realize different designs by only changing the METAL and VIA masks for the prefabricated wafers. Alternately, the manufacturer could perform all the fabrication steps in sequence, after generating the custom METAL and VIA masks. As mentioned before, the NAND2 arrays are fabricated upto the poly layer. Therefore, different designs share the same masks upto the poly layer. Thus, the manufacturer could spend considerable effort in optimizing and performing (exactly once) OPC for the poly layer mask, for maximum yield, this effort would be amortized over a large number of designs since they share common masks upto the poly layer. Therefore, such an approach could result in a reduced processing time for a new design, and reduced lithographic errors. Processing for a modern IC can take anywhere from 3 weeks up to a few months [7]. This methodology can therefore help reduce design turnaround time by stockpiling wafers which have been processed up to the metalization step. Also, this methodology simplifies the task of engineering change. When a bug is discovered and the design needs to be modified, our methodology would reduce the cost and time to modify the design (since it requires only METAL and VIA mask changes). We implemented several ISCAS89 and MCNC91 benchmark circuits using our approach. We compared the area, delay and power of several designs implemented using our approach with the ASIC approach (standard cell based design). The experimental results demonstrate that on average, our approach has a delay penalty of 40%, an area penalty of 12%, and a power increase of 7% compared to an ASIC design approach. This is better than the previously reported structured ASIC approach of [8] which has a delay overhead of 101% and an area overhead of 508% compared to the ASIC approach. We also performed lithographical simulations of the poly and metal masks of the designs implemented using our approach as well as ASIC design approach. These lithographical simulation results demonstrate that our approach has lower errors on the poly and the Metal1 layers by 7% and 24% respectively compared to the ASIC approach. The key contributions of this paper are:
3. OUR APPROACH
With the increasing cost of the masks required for an ASIC design and the systematic lithographical variations due to the optical proximity effects, it is beneficial to implement designs using the NAND2 structured ASIC approach presented in this paper. Our approach uses NAND2 arrays which allow different designs to share most of the fabrication masks, and also reduces lithographical variations due to the layout regularity of the NAND2 cells in the array. The NAND2 cell used in our approach is discussed in Section 3.1. In Section 3.2, we provide details about mapping a design to a NAND2 cell array. The methodology used to characterize the NAND2 array for delay, area, power and lithographical variations is presented in Section 3.3.
3.1 NAND2 Cell Design
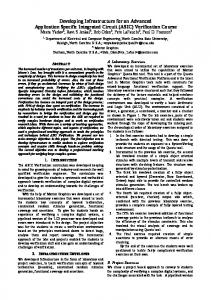
A 2-input NAND gate is functionally complete. Any logic equation can be implemented using a combination of NAND2s. Other functionally complete sets of gates are {AND2, INV}, {OR2, INV}, and NOR2 [7]. Using the {AND2, INV} or {OR, INV} combination for a structured ASIC is not very practical, since different designs may use different numbers of AND2/OR2 and INV gates. Therefore, it would be difficult to find an optimal ratio of the number of AND2/OR2 cells to the number of INV gates that should be used in the design. The NOR2 and NAND2 gates also offer functional completeness. The NAND2 gate is a better choice than the NOR2 gate because the NOR2 gate has two PMOS transistors in series, while the NAND2 gate uses two NMOS transistors in series. The NMOS transistor typically occupies half the area of a PMOS transistor for the same delay; hence the NAND2 gate is the best choice as the underlying gate in an array of gates. The layout of the NAND2 cell used in our approach is shown in Figure 1. The size of the NAND2 cell is 1.6µm × 2.6µm. The two PMOS transistor share the output terminal which is in the center. The landing sites for both inputs and the output are all in METAL1. Note that the NAND2 cell layout shown in Figure 1 is symmetrical along the vertical axis up to the poly layer. This is helpful in many ways. Firstly, when a circuit is mapped to the NAND2 array, the placer tool can map a NAND2 gate in the circuit
• Developed structured ASIC methodology which uses NAND2 array with load dependent duplicator of drivers. • Uses NAND2 arrays. • Achieves lower lithographical errors on the poly and the Metal1 layers by 7% and 24% respectively compared to the ASIC approach. The rest of the paper is organized as follows. Section 2 briefly discusses some previous work in this area. In Section 3 we describe our approach for implementing a design using as array of NAND2 gates. In Section 4 we present experimental results, followed by conclusions in Section 5.
2.
PREVIOUS WORK
In the past, gate arrays [9, 10] have been used as an implementation method in which a design can be personalized via and metal customization. This approach was popular until standard cell based design became the dominant means to design ICs. Such gate arrays implement much of their wiring in polysilicon, resulting in slower designs. In this paper, the pre-fabricated wafer consists of an array of NAND2 gates and wiring is done on metal layers only. More recently, there have been efforts to implement structured ASIC designs by
316
Figure 1: NAND2 Cell Layout used in our approach netlist to a NAND2 cell (in the array) in the original cell orientation or the flipped orientation (flipped along the vertical axis). This often results in a lower circuit area (i.e. a circuit can be mapped to a smaller NAND2 array) and also makes the router’s task easy. Secondly, symmetrical layouts are lithography friendly. Also note that in the NAND2 cell of Figure 1, there are no bends in the poly layer, which is good for manufacturability reasons. The error on the poly layer from lithography is quite low. Thirdly, with the scaling of the minimum feature size of transistors, it is better (from a manufacturability viewpoint) to have the poly on a fixed pitch. The NAND2 cell shown in Figure 1 easily be designed to follow this poly pitch rule. Hence, the layout of the NAND2 cell shown in Figure 1 is lithography-friendly and hence good for manufacturability.
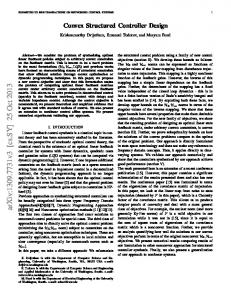
Figure 2: NAND2 Cell Array D Q CLK
Q
Figure 3: D-Flip-Flip NAND2 Cells
Implementation
using
3.3 Characterization of NAND2 array
3.2 Circuit Mapping to NAND2 Cell Array
To implement a circuit in NAND2 cell array we used SIS [16]. The input to SIS is a combinational logic network N (which is to be synthesized) in the Berkeley Logic Interchange Format (BLIF) [17]. First we perform a technology independent logic optimization using script.rugged to produce optimized logic network N ∗ . Then we map N ∗ with a library L of NAND2 gates, for both area and delay as the optimization goal. The resulting mapped gate netlist is called N 1. Our library L consists of 1×, 2×, 3× and 4× sized NAND2 gates. Note that the 1× NAND2 cell is same as the NAND2 cell shown in Figure 1 (it is used in NAND2 array). Also note that the 2×, 3× and 4× NAND cells are 2×, 3× and 4× sized versions of the cell shown in Figure 1. Also the 2×, 3× and 4× NAND2 cells are used to drive larger loads, to speed up the circuit. However, note that the 2×, 3× and 4× NAND2 cells are physically implemented by connecting 2, 3 and 4 1× NAND2 cells in parallel, respectively. Therefore, after mapping the logic network N ∗ , we replace all 2× NAND2 cells in N 1 by 2 1× NAND2 cells connected in parallel. Similarly, we replace all 3× (4×) NAND2 cells in N 1 by 3 (4) 1× NAND2 cells connected in parallel, to yield in a new netlist N 2. The new gate netlist N 2 contains only 1× NAND2 cells (the NAND2 cell shown in Figure 1 which is used in NAND2 array). The netlist N 2 is placed and routed using the SEDSM tool from Cadence [18]. The placement of NAND2 cells is done on a fixed grid using QP LACE. Since N 2 is required to be mapped to a NAND2 cell array, the placement needs to done on a fixed grid. Figure 2 shows the layout of the NAND2 cell array used in our approach. As shown in Figure 2, NAND2 cells are placed on a grid to create a rectangular array of cells. Between two rows of NAND2 cells, we leave some unused space for routing. Now, N 2 is routed using W ROU T E to route the metal wires and to connect the different gates in N 2. This finishes the mapping of the combinational logic network N to a NAND2 array. Our approach of mapping a circuit to NAND2 cell array can also be used for sequential circuits. A D-flip-flop can be implemented by using only NAND2 gates as shown in Figure 3. Therefore, we can easily apply our approach to sequential circuits as well.
317
The performance of our approach is evaluated by calculating the delay, area and power of the circuits implemented using NAND2 arrays. We also evaluated the suitability of our approach to lithography by performing lithographical simulations along with OPC. This sub-section discusses the methods and the tools used to calculate the delay, area and power of a circuit, and also to perform OPC and lithographical simulations. We compare our approach with the standard cell based approach based on the criterion of delay, area, power and lithographic error.
3.3.1 Delay The delay of the circuit N 2 is obtained by finding the largest sensitizable delay (the maximum delay of the design excluding any false paths). However, we use the gate netlist N 1 for calculating the delay because we need to separately characterize the delays of the 1×, 2×, 3× and 4× NAND2 cells (or the 2, 3 and 4 1× NAND2 cells connected in parallel) to calculate the delay of N 2. The delay is calculated using the sense [19] package in SIS [16]. Sense uses a Boolean Satisfiability solver to verify if a particular delay (initially set to the delay found from static timing analysis) is sensitizable. If no input vector is found that results in this particular delay, the delay value is reduced until an input vector is found. We use sense instead of static timing analysis (STA) because the sensitizable delay analysis avoids reporting the false paths and hence give an accurate estimate of the circuit delay. On the other hand, STA cannot exclude false paths and therefore can report pessimistic circuit delay values. We also use sense to calculate the delay of a circuit implemented using the ASIC approach.
3.3.2 Power
The dynamic power of a circuit is given by Cef f ·V DD2 ·f , where Cef f is the total switching capacitance, V DD is the supply voltage value and f is the frequency of the circuit operating at. The value of f (=1/D) is calculated using the delay of the circuit (D) obtained using the method described in Section 3.3.1. The total switching capacitance Cef f is calculated using Equation 1. X Cef f = Ck · pkxit (1) ∀ node k∈N 2
In Equation 1, Ck is the capacitance of a node k in N 2,
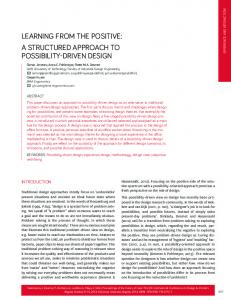
NAND2 cell library contains NAND2 cells with 1×, 2×, 3× and 4× sizes. Note that the 1× NAND2 cell is same as the NAND2 cell shown in Figure 1 which is used in NAND2 array. 2×, 3× and 4× NAND2 cells are implemented in the circuit by abutting 2, 3 and 4 1× NAND2 cells, and connecting them in parallel. The standard cell library LST D consists of 1× and 2× INV, NAND2, NAND3, NOR2, NOR3, AND2, AND3, OR2 and OR3 gates. We implemented several ISCAS and MCNC benchmark circuits using our approach as well as the ASIC approach. We also optimized the designs for both lower area (area mapped designs) and for lower delay (delay mapped designs). The delay, power and area of the circuit implemented using either our approach or ASIC approach is calculated using the methods described in Sections 3.3.1, 3.3.2 and 3.3.3 respectively. Table 1 reports the delay (in ps) and power (in mW) obtained for several benchmark circuits using the ASIC and our NAND2 array approaches. In Table 1, Column 1 reports the circuit under consideration. Columns 2 to 7 report the delay results whereas Columns 8 to 13 report the power results. The delay results for the area mapped designs are reported in Columns 2, 3 and 4. Columns 2 and 3 report the delay of the circuit implemented using the ASIC and our NAND2 array approaches respectively. Column 4 reports the ratio of the delay obtained using our NAND2 array, to the delay of the ASIC approach. Columns 5 to 7 report the same results as Columns 2 to 4 but for delay mapped designs. The average value of the ratios shown in the last row of Table 1 is calculated as a geometric mean. We observe that for area (delay) mapped circuits, our NAND2 array results in higher delay values which is on an average 1.31× (1.39×) the delay of the circuits implemented using the ASIC approach. The increase in delay is expected since the circuits are implemented using only NAND2 cells. The structured ASIC approach of [8] gives a delay value which is 2.01× the delay of the circuit implemented using an ASIC approach (standard cell based design). Therefore, our approach results in much faster implementation than the approach of [8]. Columns 8 and 9 report the power of the circuit implemented using the ASIC and NAND2 array approaches. Column 10 reports the ratio of the power obtained using NAND2 array to the power of the ASIC approach. Columns 11 to 13 reports the same results as Columns 8 to 10 but for delay mapped designs. For area mapped circuits, the NAND2 approach used less power, as expected. On average, the power of the circuits implemented using our approach was 0.91× the power of standard-cell based ASIC circuits. For delay mapped circuits, there was a slight increase in the power for the NAND2 approach. On average, the power was 1.07× the power of ASIC circuits. Since the NAND2 approach is slower (as shown in Columns 2 to 7), it is expected to consume less power (if the capacitance is kept the same). However, since the number of cells used in the NAND2 approach is greater than the ASIC approach, the switching capacitance is also increased. Thus, it is difficult to predict up-front if the NAND2 approach will result in a power improvement. As seen from the results, area mapped circuits used less power, and delay mapped circuits used more power compared to their standard-cell equivalent. We placed and routed the designs using the SEDSM tool. Figure 4 shows a placed and routed NAND2 ASIC. Table 2 reports the placed and routed area (in µm2 ) of several benchmark circuits using an ASIC and our approach. Column 1 reports the design under consideration. Columns 2 to 4 report the area results for the area mapped designs and the results for the delay mapped designs are reported in Columns 5 to 7. Columns 2 and 3 report the area of a circuit implemented using an ASIC and our NAND2 array respectively. Column 4 reports the ratio of the area obtained using NAND2 array to the area of the ASIC approach. Columns 5 to 7 reports the same results as Columns 2 to 4 but for the delay mapped designs. We observe that our approach results in slightly larger area compared to the ASIC approach.
which is the summation of the capacitance of the gate and diffusion terminals of the devices that are connected to k. pkxit is the probability of transition of the node k. After we calculate Ck and pkxit of all nodes of N 2, we can obtain the value of Cef f and hence the dynamic power of N 2 can be calculated. The value of Ck for all nodes of N 2 is calculated by adding the capacitance values of the gate and diffusion terminal of the devices connected to the node k. To obtain the value of pkxit , the signal probability of each node in the circuit is first calculated. The signal probability pk of a node k, is defined as the probability that the output of node k is at logic “1”. As described in [20], the signal probability for every node is computed assuming that the primary inputs have a signal probability of 0.5 (i.e. they have an equal probability of being “0” or “1”). The probability pk for each node is adjusted for reconvergence as explained in [20]. After we calculate pk for all nodes in N 2, the probability of transition pkxit for node k is computed as follows. As pk is the probability of node k being at logic “1”, therefore the probability of the same node k to be at logical “0” is 1 − pk . Then the probability of a transition of node k from “0” to “1” as well as from “1” to “0” is (1 − pk )pk . Therefore, the probability of transition pkxit is the sum of the probabilities of the transition from “0” to “1”, and from “1” to “0”. Hence, pkxit is equal to 2(1 − pk )pk . Now we find the value of Cef f using Equation 1 and then we can calculate the dynamic power of N 2.
3.3.3 Area The area of a circuit is the smallest die area into which the circuit can be placed and routed. As mentioned before, the gate netlist N 2 is placed and routed using the SEDSM tool from Cadence [18]. The placement of cells is done using QP LACE and the routing is done using W ROU T E. All benchmark circuits are routed using up to 4 metal layers.
3.3.4 OPC and Lithographical Simulation We use the Calibre tool from Mentor Graphics for Optical Proximity Correction (OPC) and lithographical simulation. The optical model used in our simulation has the following settings for the different parameters. The wavelength λ of the optical source used is 193nm, the numerical aperture (NA) is taken to be 0.85 and the reduction factor used is 1.0. We used 10 kernels with an optical diameter (OD) of 2.56µm and the kernel grid of 0.01µm. Standard illumination is used with the partial coherence factor (σ) equal to 0.75. The thickness of the resist layer used is assumed to be 200nm and the average image density was obtained by taking the average of the image densities at 10 different depths in the resist layer. The resist model we used for our simulation is a constant threshold resist (CTR) model with a threshold value of 0.3. After placing and routing N 2 using SEDSM , we generate its stream file (gds file) and then perform the OPC of the poly and the metal layers (Metal 1-4) using Calibre. Lithographical simulations are then performed on all layers obtained from OPC. After this, to calculate the error on any layer, we XOR the layer we obtain from lithographical simulation with the original layer that we intended to print on the wafer. The area of the layer which results from this XOR operation is used as a measure of lithographic accuracy. We also performed OPC and lithographical simulations of the designs implemented using the ASIC approach. The lithographical simulation results for both our approach and ASIC approach are presented in Section 4.
4.
EXPERIMENTAL RESULTS
In this section, we compare our approach of implementing a design using a NAND2 array with the ASIC approach. We designed our NAND2 cell library L and the standard cell library LST D using a 100nm BPTM [21] model card. Our
318
Delay (ps) Area Mapped NAND2
Ckt.
STD
C432 alu2 apex4 C499 dalu rot apex5 C1908 C5315 des apex1 apex6 C2670 i10 apex7 C3540 i8 apex3 C1355 C880 pair
1113.44 1084.87 820.51 886.83 909.98 888.68 683.96 1303.37 1365.85 923.77 771.34 694.71 846.44 1884.52 573.88 1622.89 639.06 811.87 887.56 1146.90 1049.42
Delay Mapped NAND2 Ratio
Ratio
STD
1.38 1.33 1.52 1.21 1.40 1.26 1.18 1.11 1.18 1.28 1.49 1.23 1.53 1.41 1.17 1.21 1.40 1.72 1.19 1.31 1.24
1010.60 1006.97 700.08 819.75 841.11 793.34 554.80 1117.86 1253.61 879.16 658.31 667.42 803.21 1714.02 516.80 1508.09 593.87 716.53 808.98 1126.97 963.62
1538.54 1444.80 1250.08 1069.66 1273.97 1124.02 805.79 1446.58 1614.77 1183.58 1148.56 852.10 1296.42 2657.35 669.38 1967.04 895.36 1398.31 1052.21 1504.10 1297.20
AVG
1463.73 1378.97 1232.05 1043.07 1236.48 1112.23 742.83 1389.45 1610.80 1162.60 1126.77 826.86 1241.26 2599.82 622.79 1876.91 776.95 1369.40 1021.62 1432.94 1246.11
1.31
1.45 1.37 1.76 1.27 1.47 1.4 1.34 1.24 1.28 1.32 1.71 1.24 1.55 1.52 1.21 1.24 1.31 1.91 1.26 1.27 1.29 1.39
STD 0.247 0.532 1.625 1.115 1.199 1.115 1.329 0.576 2.108 5.201 1.198 1.592 1.308 1.437 0.627 1.072 2.567 1.362 1.006 0.565 2.176
Power (mW) Area Mapped Delay Mapped NAND2 Ratio STD NAND2 Ratio 0.245 0.406 1.049 0.965 0.844 1.377 1.612 0.607 2.377 4.804 1.018 1.503 1.120 1.454 0.759 0.977 1.404 0.779 0.917 0.591 2.596
0.99 0.76 0.65 0.87 0.7 1.24 1.21 1.05 1.13 0.92 0.85 0.94 0.86 1.01 1.21 0.91 0.55 0.57 0.91 1.05 1.19 0.91
0.278 0.488 1.636 1.189 1.300 1.348 1.856 0.681 2.235 5.796 1.452 1.510 1.483 1.648 0.726 1.229 2.760 1.469 1.220 0.582 2.497
0.350 0.546 1.485 1.659 1.021 1.578 2.075 0.786 2.642 5.561 1.353 1.850 1.252 1.645 1.021 1.333 2.258 1.072 1.604 0.686 3.037
1.26 1.12 0.91 1.4 0.79 1.17 1.12 1.16 1.18 0.96 0.93 1.23 0.84 1 1.41 1.08 0.82 0.73 1.31 1.18 1.22 1.07
Table 1: Delay and Power of Circuits Implemented using Our and ASIC approach Ckt.
STD
C1355 C1908 C2670 C3540 C432 C499 C5315 C880 alu2 apex1 apex3 apex4 apex5 apex6 apex7 dalu des i10 i8 pair rot
59.4 60 67.8 89.4 36.2 60.6 108 53 51.4 94 107 134.6 78.2 71.4 39 78.2 154.2 118.6 85.4 99.8 63.8
Average
Area Mapped NAND2 Ratio 60.6 60.6 75 96.6 41.8 60.6 114.2 56.6 56.6 113.8 125 154.2 83.4 71 41.8 80 161.4 128.6 88 109 70.6
1.02 1.01 1.11 1.08 1.15 1 1.06 1.07 1.1 1.21 1.17 1.15 1.07 0.99 1.07 1.02 1.05 1.08 1.03 1.09 1.11 1.08
STD 61.8 60.6 71 94.6 39.4 61.4 111 53.4 53.4 99.8 111.4 139.4 78.6 71 39.4 78.2 161.4 125.4 89.4 103.8 67.8
Delay Mapped NAND2 Ratio 72 67.8 78.2 104 46.6 72 121.4 59.4 60.6 120 131.4 164.6 89.4 77 46.2 85 168.6 135.8 92.6 114.2 75
1.17 1.12 1.1 1.1 1.18 1.17 1.09 1.11 1.13 1.2 1.18 1.18 1.14 1.08 1.17 1.09 1.04 1.08 1.04 1.1 1.11 1.12
Table 2: PNR Area of Circuits Implemented in µm using Our and ASIC Approach
Figure 4: Placed and Routed NAND2 ASIC 2
the ASIC approach. Similar ratios are reported in Columns 8-11 for Metal1-4 respectively. On average, for the mapped design, the lithographical error of the NAND2 array based approach is lower by 7% and 24% for the poly and Metal1 layers, compared to the error for the ASIC approach. However, the errors of our approach are higher than the ASIC approach for Metal2 and Metal4. The average reported in the last row of Table 3 is calculated as an arithmetic mean. Columns 12 to 21 reports the same results as Columns 2 to 11 but for the delay mapped designs. On average, for delay mapped designs, the lithographical errors of NAND2 array is lower than the errors of the ASIC approach on the poly and Metal1 layers by 6% and 29% respectively. However, the errors are again higher for the NAND2 array based implementation on the Metal2-4 layers, compared to the error of ASIC approach. Note that the lithographical error on the poly and the local interconnect layer (i.e. METAL1) are more crucial for the circuit performance. The error in the poly layer translates into the channel length variations which can affect the circuit performance significantly. Metal 1 typically has the highest sheet resistivity compared to Metal2-4 and therefore, a large error on Metal1 will result in unpredictable circuit performance and can even leads to the effects like electromigration. In this context, our NAND2 array based circuit implementation performs significantly better than the ASIC approach. The experimental results demonstrate that our structured ASIC type VLSI design approach is better than the previously reported structured ASIC approaches [14, 8]. On average, the area (delay) of the circuits implemented using our NAND2 array is 1.12× (1.4×) the area (delay) of the circuits implemented using the ASIC approach. The approach of [14] gives an area (delay) value which is 4.96× (2.89×)
On average, the area of our approach was 1.08× (1.12×) the area of ASIC approach for the area (delay) mapped design. The approaches of [14] and [8] result in the area which is 4.96× and 6.08× the area of circuit implemented using the ASIC approach. We also performed OPC and the lithographical simulations of several benchmarks circuits using the Calibre tool. The values of various parameters of the optical and resist model used in our simulations are discussed in Section 3.3.4. The circuits are first placed and routed using SEDSM and then the resulting placed and routed designs are used for OPC and lithographical simulations. The error on any layer (poly or metal) is obtained by XORing the output layer of the lithographical simulation and the original layer that we intended to print on wafer. Table 3 reports the lithographical error results for the poly and Metal1-4 layers for several benchmark circuits implemented using our NAND2 array and the ASIC approach. In Table 3, Column 1 reports the design under consideration. Columns 2 to 11 report the results for the area mapped designs. Columns 2 to 6 reports the result for the circuit implemented using the ASIC approach. In Column 2, the percentage error on the poly layer P (E% ) is reported, which is defined as the area of the poly error layer as a percentage of the area of the desired poly layer (i.e. the poly layer before OPC). Similarly, the percentage M1 M2 M3 M4 errors on Metal1-4 (E% , E% , E% and E% ) are reported in Columns 3-6 respectively, for the ASIC approach. ColP umn 7 reports the ratio (ER ) of the percentage error on the poly layer of the circuit implemented using our NAND2 array approach to the percentage error on the poly layer for
319
Area Mapped Ckt. C432 apex5 C1355 C3540 i8 alu2 C1908 C499 apex6 dalu
EP % 4.82 4.75 4.65 4.79 4.66 4.79 4.67 4.62 4.69 4.69
ASIC Approach EM 2 EM 3 % % 3.39 2.5 2.99 2.32 3.09 2.52 3.04 2.34 2.94 2.3 3.04 2.34 3.09 2.37 3.27 2.4 3.04 2.45 2.96 2.29
EM 1 % 2.77 2.74 2.64 2.73 2.77 2.73 2.65 2.62 2.74 2.71
AVG
EM 4 % 3.2 2.34 4.55 2.03 2 2.03 3.03 3.41 2.74 2.1
Delay Mapped NAND2 Array M2 M3 ER ER 1.08 0.99 1.15 1.01 1.14 0.94 1.13 0.99 1.14 1.01 1.10 0.98 1.13 1.00 1.06 0.97 1.16 1.03 1.13 1.03
P ER
M1 ER
M4 ER
0.90 0.92 0.94 0.91 0.94 0.91 0.93 0.94 0.93 0.93
0.73 0.75 0.77 0.75 0.75 0.75 0.77 0.77 0.75 0.76
1.05 1.13 0.60 1.29 1.38 1.35 1.09 0.71 1.22 1.12
0.93
0.76
1.12
1.00
EP % 4.62 4.69 4.58 4.67 4.62 4.68 4.59 4.58 4.65 4.66
ASIC Approach EM 2 EM 3 % % 3.12 2.35 2.88 2.35 3.05 2.5 2.93 2.31 2.89 2.39 2.88 2.33 3.14 2.3 3.01 2.39 2.98 2.47 2.91 2.35
EM 1 % 2.65 2.67 2.59 2.69 2.77 2.71 2.62 2.58 2.68 2.67
1.09
EM 4 % 2.6 2.4 3.76 1.94 1.95 2.29 3.78 2.57 3 2.41
P ER
M1 ER
0.94 0.93 0.95 0.93 0.94 0.93 0.95 0.95 0.94 0.94
0.71 0.71 0.73 0.71 0.69 0.70 0.72 0.73 0.70 0.71
0.94
0.71
NAND2 Array M2 M3 ER ER 1.24 1.10 1.19 1.03 1.23 1.00 1.16 1.06 1.18 1.00 1.17 1.04 1.22 1.11 1.17 1.07 1.18 1.01 1.17 1.05 1.19
1.05
M4 ER 1.07 1.11 0.76 1.31 1.24 0.95 0.69 1.20 1.17 1.10 1.06
Table 3: Lithographical Simulation Results [4] A. Agarwal, D. Blaauw, and V. Zolotov, “Statistical timing analysis for intra-die process variations with spatial correlations,” in ICCAD, pp. 900–907, 2003. [5] K. Cao, S. Dobre, and J. Hu, “Standard cell characterization considering lithography induced variations,” in DAC ’06: Proceedings of the 43rd annual conference on Design automation, pp. 801–804, 2006. [6] “The International Technology Roadmap for Semiconductors.” http://public.itrs.net/, 2003. [7] J. Rabaey, Digital Integrated Circuits: A Design Perspective. Prentice Hall Electronics and VLSI Series, Prentice Hall, 1996. [8] K. Gulati, N. Jayakumar, and S. P. Khatri, “A structured ASIC design approach using pass transistor logic.,” in ISCAS, pp. 1787–1790, IEEE, 2007. [9] M. Takechi, K. Ikuzaki, T. Itoh, and M. Fujita, “A CMOS 12K gate-array with flexible 10Kb memory,” in Proceedings of the ISSCC, pp. 258–259, Feb 1984. [10] S. Tanaka, J. Iwamura, J. Ohno, M. Maeguchi, H. Tango, and K. Doi, “A sub-nanosecond 8K-gate CMOS/SOS gate array,” in Proceedings of the ISSCC, pp. 260–261, Feb 1984. [11] A. Koorapaty, V. Chandra, K. Y. TONG, C. Patel, L. Pillegi, and H. Schmit, “Heterogeneous programmable logic block architectures,” in Design Automation and Test in Europe Conference, Mar 2003. [12] A. Koorapaty, L. Pillegi, and H. Schmit, “Heterogeneous logic block architectures for via-patterned programmable fabrics,” in 13th International Conference on Field Programmable Logic and Applications, Sep 2003. [13] A. Koorapaty, V. Kheterapal, P. Gopalakrishnan, and L. Pillegi, “Exploring logic block granularity for regular fabrics,” in Design Automation and Test in Europe Conference, vol. 1, pp. 468–473, Feb 2004. [14] N. Jayakumar and S. Khatri, “A metal and via maskset programmable VLSI design methodology using PLAs,” in Proceedings, IEEE/ACM International Conference on Computer-Aided Design, pp. 590–594, Nov 2004. [15] L. Pillegi, H. Schmit, A. Strojwas, P. Gopalakrishnanand, V. Kheterapal, A. Koorapaty, C. Patel, S. Rovner, and Y. Tong, “Exploring regular fabrics to optimize the performance-cost trade-off,” in Design Automation Conference, June 2003. Presentation slides, http://videos.dac.com/videos/40th/46/46 4/46 4slides.pdf. [16] E. M. Sentovich, K. J. Singh, L. Lavagno, C. Moon, R. Murgai, A. Saldanha, H. Savoj, P. R. Stephan, R. K. Brayton, and A. L. Sangiovanni-Vincentelli, “SIS: A System for Sequential Circuit Synthesis,” Tech. Rep. UCB/ERL M92/41, Electronics Research Lab, Univ. of California, Berkeley, CA 94720, May 1992. [17] R. K. Brayton et al., “BLIF-MV: An Interchange Format for Design Verification and Synthesis,” Tech. Rep. UCB/ERL M91/97, Electronics Research Lab, Univ. of California, Berkeley, CA 94720, Nov. 1991. [18] Cadence Design Systems, Inc., 555 River Oaks Parkway, San Jose, CA 95134, USA, Envisia Silicon Ensemble Place-and-route Reference, Nov 1999. [19] P. McGeer, A. Saldanha, R. Brayton, and A. Sangiovanni-Vincentelli, Logic Synthesis and Optimization, ch. Delay Models and Exact Timing Analysis, pp. 167–189. Kluwer Academic Publishers, 1993. [20] K. Gulati, N. Jayakumar, and S. P. Khatri, “A probabilistic method to determine the minimum leakage vector for combinational designs,” in ISCAS, 2006. [21] Y. Cao, T. Sato, D. Sylvester, M. Orshansky, and C. Hu, “New paradigm of predictive MOSFET and interconnect modeling for early circuit design,” in Proc. of IEEE Custom Integrated Circuit Conference, pp. 201–204, Jun 2000. http://www-device.eecs.berkeley.edu/ ptm.
Figure 5: Error Layers for Poly and Metal1-4 of NAND2 ASIC the area (delay) value of the ASIC approach. The approach of [8] results in a circuit area (delay) of 6.08× (2.01×) the delay of ASIC approach. Therefore, our NAND2 array based circuit implementation approach is much better than the approaches of [14, 8]. Lithographical simulation results demonstrate that our approach is more lithography friendly than the ASIC approach and hence good from a manufacturability point of view.
5.
CONCLUSIONS
6.
REFERENCES
With the increasing cost of the masks required for an ASIC design, and the systematic variations due to the optical proximity effects, it is desirable to implement designs using regular circuit structures. In this paper, we present a new structured ASIC type VLSI design approach which utilizes an array of a regular 2-input NAND gates. Our NAND2 array based circuit implementation reduces the manufacturing cost because different designs share the same masks up to the poly layer. The regular layout structure of our NAND2 array also helps in reducing the systematic variations. We compared the performance of our NAND2 array with the ASIC approach by implementing several benchmark circuits using both methods. The experimental results demonstrate that on average, our approach has a delay penalty of 40%, an area penalty of 12%, and a power increase of 7% compared to an ASIC design approach. This is better than the previously reported structured ASIC approaches. We also performed lithographical simulations of the poly and metal masks of the designs implemented using our approach as well as the ASIC design approach. These lithographical simulation results demonstrate that our approach has lower errors on the poly and the Metal1 layers by 7% and 24% respectively compared to the ASIC approach.
[1] “Sematech Annual Report.” http://www.sematech.org/public/ corporate/annrpt/annrpt02/pdf/mask.pdf, 2002. [2] A. Sangiovanni-Vincentelli, “The tides of EDA.” Keynote Talk, Design Automation Conference, June 2003. [3] H. Chang and S. S. Sapatnekar, “Statistical timing analysis under spatial correlations,” vol. 24, pp. 1467–1482, Sept. 2005.
320