Received 17 May 1999; accepted 25 May 1999. Laser-cooled trapped ions can be strongly coupled and form crystalline states. In this paper we.
PHYSICS OF PLASMAS
VOLUME 7, NUMBER 1
JANUARY 2000
SPECIAL TOPICS SECTION Crystalline order in laser-cooled, non-neutral ion plasmas J. J. Bollinger, T. B. Mitchell, X.-P. Huang, W. M. Itano, J. N. Tan,a) B. M. Jelenkovic´,b) and D. J. Wineland Time and Frequency Division, National Institute of Standards and Technology, Boulder, Colorado 80303
共Received 17 May 1999; accepted 25 May 1999兲 Laser-cooled trapped ions can be strongly coupled and form crystalline states. In this paper we review experimental studies that measure the spatial correlations of Be⫹ ion crystals formed in Penning traps. Both Bragg scattering of the cooling-laser light and spatial imaging of the laser-induced ion fluorescence are used to measure these correlations. In spherical plasmas with more than 2⫻105 ions, body-centered-cubic 共bcc兲 crystals, the predicted bulk structure, are the only type of crystals observed. The orientation of the ion crystals can be phase locked to a rotating electric-field perturbation. With this ‘‘rotating wall’’ technique and stroboscopic detection, images of individual ions in a Penning trap are obtained. The rotating wall technique also provides a precise control of the time-dilation shift due to the plasma rotation, which is important for Penning trap frequency standards. 关S1070-664X共00兲01501-9兴
body-centered-cubic 共bcc兲 lattice is predicted at ⌫⬇170.3,7 From a theoretical perspective, the strongly coupled OCP has been used as a paradigm for condensed matter for decades. However, only recently has it been realized in the laboratory.8 Experimentally, freezing of small numbers (N⬍50) of laser-cooled atomic ions into Coulomb clusters was first observed in Paul traps.9–11 With larger numbers of trapped ions, concentric shell structures were observed directly in Penning12 and linear Paul13,14 traps. The linear Paul traps provided strong confinement in the two dimensions perpendicular to the trap axis and very weak confinement along the trap axis. This resulted in cylindrically shaped plasmas whose axial lengths are large compared to their cylindrical diameters. Cylindrical-shell crystals that are periodic with distance along the trap axis were observed. The diameter of these crystals was limited to ⬃10a WS in Ref. 13 and ⬃30a WS in Ref. 14, presumably due to rf heating,15 which is produced by the time-dependent trapping fields and increases with the plasma diameter. These plasma diameters appear to be too small to observe the three-dimensional 共3-D兲 periodic crystals predicted for the infinite, strongly coupled OCP. Strong coupling and crystallization have also been observed with particles interacting through a screened Coulomb potential. Examples include dusty plasma crystals16 and colloidal suspensions.17,18 Because Penning traps use static fields to confine charged particles, there is no rf heating. This has enabled ion plasmas that are large in all three dimensions to be laser cooled. For example, we have laser cooled ⬃106 Be⫹ ions in an approximately spherical plasma with diameter ⬃200a WS . With these large ion plasmas we have used Bragg scattering of the cooling laser light to detect the formation of bcc crystals,19,20 the predicted state for a bulk OCP with ⌫ ⬎170. In addition, we have studied the spatial correlations in
I. INTRODUCTION
In this paper we review recent progress on the study of strongly coupled ion plasmas in Penning traps. It is similar to the review in the conference proceedings of Ref. 1 and contains more background material on Bragg scattering results than Ref. 2, which focuses on results obtained from real images of the ion crystals. Trapped ions are a good example of a one-component plasma 共OCP兲. A OCP consists of a single charged species immersed in a neutralizing background.3 In an ion trap, the trapping fields provide the neutralizing background.4 Examples of OCPs include such diverse systems as the outer crust of neutron stars5 and electrons on the surface of liquid helium.6 The thermodynamic properties of the classical OCP of infinite spatial extent are determined by its Coulomb coupling constant,3 ⌫⬅
e2 1 , 4 ⑀ o a WSk BT
共1兲
which is a measure of the ratio of the Coulomb potential energy of nearest neighbor ions to the kinetic energy per ion. Here, ⑀ 0 is the permittivity of the vacuum, e is the charge of an ion, k B is Boltzmann’s constant, T is the temperature, and a WS is the Wigner–Seitz radius, defined by 4 (a WS) 3 /3 ⫽1/n 0 , where n 0 is the ion density. For low-temperature ions in a trap, n 0 equals the equivalent neutralizing background density provided by the trapping fields. Plasmas with ⌫⬎1 are called strongly coupled. The onset of fluid-like behavior is predicted at ⌫⬇2,3 and a phase transition to a a兲
Present address: Department of Physics, Harvard University, Cambridge, Massachusetts 02138. b兲 On leave from the Institute of Physics, University of Belgrade, Belgrade, Yugoslavia. 7
Downloaded 28 Sep 2001 to 132.163.136.56. Redistribution subject to AIP license or copyright, see http://ojps.aip.org/pop/popcr.jsp
8
Bollinger et al.
Phys. Plasmas, Vol. 7, No. 1, January 2000
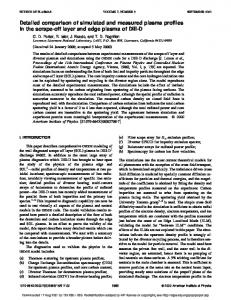
FIG. 1. Schematic view of the cylindrical trap with real space imaging optics for the side-view camera and Bragg diffraction detection system for the axial cooling beam. The size of the plasma is exaggerated. The cross section of the rotating quadrupole field 共in the x-y plane兲 is shown in the insert. From Ref. 21.
planar, lens-shaped plasmas with axial thickness ⱗ10a WS . These plasmas consist of extended, two dimensionally periodic lattice planes. The importance of the plasma boundary in this case results in different crystalline structures depending on the details of the plasma shape. A potential drawback of the Penning trap versus the rf trap is that the ions rotate about the trap magnetic field, and this has previously prevented the imaging of the ion crystals as done in Paul traps. This is because the rotation, created by the E ⴛ B drift due to the radial electric and the trap magnetic fields is, in general, not stable. For example, fluctuations in the plasma density or shape produce fluctuations in the ion space charge fields that change the plasma rotation. However, we are able to phase lock the rotation of the lasercooled ion crystals to a rotating electric field perturbation.21,22 The success of this ‘‘rotating wall’’ technique enables us to strobe the cameras recording the ion fluorescence synchronously with the plasma rotation and obtain images of individual ions in the plasma crystals.23 Figure 1 is a schematic of the cylindrical Penning trap we use to confine 9Be⫹ ions. The trap consists of a 127 mm long vertical stack of cylindrical electrodes with an inner diameter of 40.6 mm, enclosed in a room temperature, 10⫺8 Pa vacuum chamber. The uniform magnetic field B0 ⫽4.46 T is aligned parallel to the trap axis within 0.01° and produces a 9Be⫹ cyclotron frequency ⍀⫽2 ⫻7.61 MHz. A quadratic, axially symmetric potential (m z2 /2e)(z 2 ⫺r 2 /2) is generated near the trap center by biasing the central electrodes to a negative voltage ⫺V 0 . At V 0 ⫽1 kV, the singleparticle axial frequency z ⫽2 ⫻799 kHz and the magne-
tron EⴛB drift frequency m ⫽2 ⫻42.2 kHz. The trapped Be⫹ ions are Doppler laser cooled by two 313 nm laser beams. The principal cooling beam 共waist diameter ⬃0.5 mm, power ⬃50 W兲 is directed parallel to B0. A second, typically weaker cooling beam with a much smaller waist 共⬃0.08 mm兲 is directed perpendicularly to B0 共not shown in Fig. 1兲. This beam can also be used to vary the plasma rotation frequency by applying a torque with radiation pressure. With this configuration, ion temperatures close to the 0.5 mK Doppler laser-cooling limit are presumably achieved. However, experimentally we have only placed a rough 10 mK upper bound on the ion temperature.24 For a typical value of n 0 ⫽4⫻108 cm⫺3, this implies ⌫⬎200. Two types of imaging detectors were used. One is a charge-coupled device 共CCD兲 camera coupled to an electronically gatable image intensifier. The other is an imaging photomultiplier tube based on a microchannel-plate electron multiplier and a multielectrode resistive anode for position sensing. For each detected photon, the position coordinates are derived from the current pulses collected by the different electrodes attached to the resistive anode. This camera therefore provides the position and time of each detected photon. However, in order to avoid saturation, we placed up to 20 dB of attenuation in front of this camera to lower the detected photon counting rate to less than ⬃300 kHz. In thermal equilibrium, the trapped ion plasma rotates without shear at a frequency r where m ⬍ r ⬍⍀⫺ m . 25,26 For the low-temperature work described here, the ion density is constant and given by n 0 ⫽2 ⑀ 0 m r (⍀⫺ r )/e 2 . With a quadratic trapping potential the plasma has the simple shape of a spheroid, z 2 /z 20 ⫹r 2 /r 20 ⫽1, where the aspect ratio ␣ ⬅z 0 /r 0 depends on r . 24,26 This is because the radial binding force of the trap is determined by the Lorentz force due to the plasma’s rotation through the magnetic field. Thus low r results in a lenticular plasma 共an oblate spheroid兲 with a large radius. As r increases, r 0 shrinks and z 0 grows, resulting in an increasing ␣. However, large r ( r ⬎⍀/2) produces a large centrifugal acceleration that opposes the Lorentz force and lenticular plasmas are once again obtained for r ⬃⍀⫺ m . In our work, torques from a laser or a rotating electric field are used to control r , and therefore the plasma density and shape. The plasma shape is observed by imaging the ion fluorescence scattered perpendicularly to B0 with an f /5 objective. 共See Fig. 1.兲 All possible values of r from m to ⍀⫺ m have been accessed using both methods of applying a torque.22,27,28 Azimuthally segmented compensation electrodes located between the main trap electrodes are used to apply the rotating electric-field perturbation. Both a rotating quadrupole 共see the inset in Fig. 1兲 and rotating dipole field 共not shown in Fig. 1兲 have been used to control r . Below we explain how the rotating quadrupole field provides precise control of r . II. BRAGG SCATTERING A. BCC crystals
An infinite OCP with ⌫ⲏ170 is predicted to form a bcc lattice. However, the bulk energies per ion of the face-
Downloaded 28 Sep 2001 to 132.163.136.56. Redistribution subject to AIP license or copyright, see http://ojps.aip.org/pop/popcr.jsp
Phys. Plasmas, Vol. 7, No. 1, January 2000
FIG. 2. Bragg diffraction patterns from a plasma phase locked to a rotating quadrupole field ( r ⫽2 ⫻140 kHz,n 0 ⬇4.26⫻108 cm⫺3 , ␣ ⬇1.1). 共a兲 A 1 s time-averaged pattern. The long rectangular shadow 共highlighted by solid lines兲 is from the deflector for the incident beam; four line shadows 共highlighted by dashed lines兲 that form a square are due to a wire mesh at the exit window of the vacuum chamber. The small open circle near the center of the figure marks the position of the undeflected laser beam. 共b兲 Time-resolved pattern obtained nearly simultaneously with 共a兲 by strobing the camera with the rotating field 共integration time ⬇5 s兲. A spot is predicted at each intersection of the rectangular grid lines for a bcc crystal with a 关110兴 axis aligned with the laser beam. The grid spacings were determined from the n 0 calculated from r and are not fitted. From Ref. 22.
centered-cubic 共fcc兲 and hexagonal-close-packed 共hcp兲 lattices differ very little from bcc (⬍10⫺4 ). 29 Because some of the fcc and hcp planes have lower surface energies than any of the bcc planes, a boundary can have a strong effect on the preferred lattice structure. One calculation29 estimates that the plasma may need to be ⲏ100a WS across its smallest dimension to exhibit bulk behavior. For a spherical plasma this corresponds to ⬃105 ions. We used Bragg scattering to measure the spatial correlations of approximately spherical plasmas with N⬎2⫻105 trapped Be⫹ ions. 19,20 The cooling-laser beam directed along the trap axis was used for Bragg scattering, as indicated in Fig. 1. First the plasma shape was set to be approximately spherical. 共In early experiments this was done with the perpendicular laser beam; more recent experiments used the rotating wall.兲 The parallel laser beam was then tuned approximately half a linewidth below resonance, and a Bragg scattering pattern recorded 共⬃1–30 s integration兲. The plasma was then heated and recooled, and another Bragg scattering pattern was recorded. Because the 313 nm wavelength of the cooling laser is small compared to the interion separation 共⬃10–20 m兲, Bragg scattering occurs in the forward 共few degree兲 scattering direction. In order for a diffracted beam to form, the incident and scattered wave vectors ki and ks must differ by a reciprocal lattice vector 共Laue condition兲.30 In a typical x-ray crystal diffraction case, satisfying the Laue condition for many reciprocal lattice vectors, requires that the incident radiation have a continuous range of wavelengths. Here the Laue condition is relaxed because of the small size of the crystal, so a crystalline Bragg diffraction pattern is frequently obtained, even with monochromatic radiation. Figure 2共a兲 shows a time-averaged diffraction pattern obtained on a spherical plasma with N⬃7.5⫻105 . The multiple concentric rings are due to Bragg scattering off different planes of a crystal. A concentric ring rather than a dot pattern is observed because the crystal was rotating about the laser beam. In general, many different patterns were observed,
Crystalline order in laser-cooled, non-neutral ion . . .
9
FIG. 3. Histogram showing the numbers of peaks 共not intensities兲 observed as a function of q•a WS 共defined in the text兲 for 30 time-averaged Bragg scattering patterns obtained on two different spherical plasmas with N⬎2 ⫻105 . The dotted lines show the expected peak positions for a bcc crystal, normalized to the center of gravity of the peak at A 共corresponding to Bragg reflections off 兵110其 planes兲. From Ref. 20.
corresponding to Bragg scattering off crystals with different orientations. Figure 3 summarizes the analysis of approximately 30 time-averaged patterns obtained on two different spherical plasmas with N⬎2⫻105 . It shows the number of Bragg peaks as a function of the momentum transfer q ⫽ 兩 ks ⫺ki 兩 ⫽2k sin(scatt /2) (⯝k scatt for scattⰆ1), where k ⫽2 / is the laser wave number and scatt is the scattering angle. The density dependence of the Bragg peak positions is removed by multiplying q by a WS , which was determined from r . The positions of the peaks agree with those calculated for a bcc lattice, within the 2.5% uncertainty of the angular calibration. They disagree by about 10% with the values calculated for a fcc lattice. The ratios of the peak positions of the first five peaks agree to within about 1% with the calculated ratios for a bcc lattice. This provides strong evidence for the formation of bcc crystals in spherical plasmas with N⬎2⫻105 ions. This result is significant because it is the first evidence for bulk behavior in a strongly coupled OCP in the laboratory. B. Rotating wall
By strobing the camera recording the Bragg scattering pattern synchronously with the plasma rotation, we should be able to recover a dot pattern from the time-averaged concentric ring pattern in Fig. 2共a兲. Initially we used the time dependence of the Bragg scattered light to sense the phase of the plasma rotation.20,31 More recently we used a rotating electric field perturbation to phase lock the ion plasma rotation.21,22 Consider the rotating quadrupolar perturbation shown in the inset of Fig. 1. This z-independent perturbation produces a small distortion in the shape of the spheroidal plasma. In particular, the plasma acquires a small elliptical cross section normal to the z axis. 共In our work the distortion created by the rotating quadrupole field was typically less than 1% of the plasma diameter.兲 The elliptical boundary rotates at the applied rotating wall frequency w . An ion near the plasma boundary experiences a torque due to this rotating boundary. If the ion is rotating slower than w , the torque will speed it up. If it is rotating faster than w , the torque will slow it
Downloaded 28 Sep 2001 to 132.163.136.56. Redistribution subject to AIP license or copyright, see http://ojps.aip.org/pop/popcr.jsp
10
Phys. Plasmas, Vol. 7, No. 1, January 2000
down. Through viscous effects, this torque is transmitted to the plasma interior. Therefore, if other external torques are small, the rotating wall perturbation will make r equal w . Crystallized plasmas behave more like a solid than a liquid or gas. Because the viscosity is high, the whole plasma will tend to rotate rigidly with its boundary. In particular, the orientation of the ion crystals can phase-lock to the rotating quadrupolar perturbation if the frequency difference between r and w is small. To check for phase-locked control of r , we strobed the camera recording the Bragg scattering pattern in Fig. 2共a兲 with the synthesizer used to generate the rotating wall signal. Specifically, once each 2 / w period, the rotating wall signal gated the camera on for a period ⱗ0.02(2 / w ). The resulting Laue dot pattern in Fig. 2共b兲 shows that the plasma rotation was phase locked to the rotating electric-field perturbation. The dot pattern provides detailed information on the number and orientation of the crystals that contributed to the Bragg scattering signal. For example, the pattern in Fig. 2共b兲 was due to a single bcc crystal with a 关110兴 axis aligned along the laser beam. For phase-locked operation of the rotating wall, other external torques must be small. For example, a misalignment of the trap magnetic field with the trap electrode symmetry axis of ⬎0.01° prevented phaselocked control of the plasma rotation. In our work, alignment to ⱗ0.003° was obtained by minimizing the excitation of zero-frequency plasma modes.27,28 In addition to the rotating quadrupole perturbation, phase-locked control was also achieved with a uniform rotating electric field 共a ‘‘dipole’’ field兲. In fact, under many circumstances a uniform oscillating field worked equally well. In these cases the corotating component of the oscillating field controlled the plasma rotation while the perturbing effects due to the counter-rotating component were minimal. The simplicity of the oscillating dipole field makes it a convenient tool for controlling r . However, in a quadratic trap, control of r with a uniform rotating or oscillating electric field requires an effect that breaks the separation of centerof-mass and internal degrees of freedom of the plasma. In our work this is done by impurity ions that experience a different centrifugal potential than the 9Be⫹ions. 22
Bollinger et al.
FIG. 4. Real-space images of an N⬃1.8⫻105 ion plasma phase locked with an oscillating dipole field at r ⫽2 ⫻120 kHz. 共a兲 Time-averaged sideview image showing the overall plasma shape. The bright line of fluorescence through the plasma center is due to a laser beam directed perpendicularly to B0. The plasma shape is approximately spherical. The presence of heavier-mass ions, which centrifugally separate from the 9Be⫹ ions, produces the straight vertical boundaries in the image. 共b兲 Strobed top-view image, obtained simultaneously with 共a兲, showing the presence of a bcc crystal in the plasma center. The distance scales in 共a兲 and 共b兲 are different, as noted.
⬎80 m. the cooling-laser beam directed perpendicularly to Bo was used to illuminate a section of the plasma within the depth of field. Figure 4 shows side-view and top-view images of an approximately spherical plasma with N⬃1.8⫻105 . The fluorescence from the perpendicular laser beam used to highlight a small region of the plasma is clearly visible. In the topview image, a square grid of dots is observed near the plasma center. The measured spacing between nearest neighbor dots is 12.8⫾0.3 m, in good agreement with the 12.5 m spacing expected for viewing along a 关100兴 axis of a bcc crystal with density determined by the r set by the rotating field. Real-space imaging provides direct information on the location and size of the crystals. In Fig. 4 the crystal was located in the radial center of the plasma and was at least 230 m across, or at least one-quarter of the plasma diameter. For lenticular plasmas with 2z 0 ⱗ80 m, all of the ions within the plasma are resolved without the use of the perpendicular laser beam. Lenticular plasmas are obtained with r slightly greater than m . For small plasmas (N ⱗ2000 ions) we were able to use the rotating-dipole electric field to lower r and obtain a single plane while maintaining long-range order in the top-view images. Figure 5共a兲 shows a
III. REAL-SPACE IMAGES
Bragg scattering measures the Fourier transform of the spatial correlations of the trapped ions. It provides a picture of these correlations in reciprocal-lattice space. With phaselocked control of r , real-space imaging of individual ions in a Penning trap becomes possible. To obtain real-space images with high resolution, we replaced the Bragg scattering optics 共see Fig. 1兲 with imaging optics, starting with an f /2 objective, which formed a real, top-view image of the ion plasma. The combined resolution limit of the optics and camera was less than 5 m near the optimal object plane of the f /2 objective. This is less than the ⬃10 m resolution limit required to resolve individual ions. However, the depth of field of an f /2 objective for 10 m resolution is ⬃80 m. For lenticular plasmas with 2z 0 ⱗ80 m, all of the ions within the plasma were resolvable. For plasmas with 2z 0
FIG. 5. Strobed top-view images of a small (N⬃300) Be⫹ ion plasma phase-locked with a rotating dipole field at 共a兲 r ⫽2 ⫻65.7 kHz and 共b兲 66.5 kHz. Below are unstrobed side views showing the axial lattice planes. Heavier-mass ions are located outside the 9Be⫹ ions.
Downloaded 28 Sep 2001 to 132.163.136.56. Redistribution subject to AIP license or copyright, see http://ojps.aip.org/pop/popcr.jsp
Phys. Plasmas, Vol. 7, No. 1, January 2000
top- and side-view image of such a plasma. Near the plasma center a 2-D hexagonal lattice is observed, the preferred lattice for a 2-D system. Here each dot is the image of an individual ion. Starting with a single plane like that shown in Fig. 5共a兲, we studied the structural phase transitions that occur as r is increased.23 With increasing r , the radial confining force of the Penning trap increases, which decreases r 0 . At a particular point, there is a structural phase transition near the plasma center from a single, hexagonal lattice plane to two lattice planes where the ions form a square grid in each plane, as shown in Fig. 5共b兲. Further increases in r increase the number of ions per unit area of each plane as well as the spacing between the planes. During this process the square lattice planes smoothly change into rhombic lattice planes and eventually there is a sudden transition to hexagonal lattice planes. Further increases in r eventually produce a structural transition to three square lattice planes, and the basic pattern repeats. The structure of the crystallized ions depends sensitively on the projected areal density of the plasma. The side- and top-view images were analyzed to characterize the phase structure. Within a layer, the structural order is characterized by the primitive vectors a1 and a2 共which are observed to be equal in magnitude兲 and the angle 共⭐90°兲 between them. The interlayer order is characterized by the axial positions z n of the n lattice planes 共measured by the side-view camera兲 and the interlayer displacement vector cn between layers 1 and n. Hence, the equilibrium positions in the 共x,y兲 plane of ions in axial planes 1 and n are given by R1⫽ia1⫹ ja2 and Rn⫽ia1⫹ ja2⫹cn, where i,j are integers. Three different types of intralayer ordering are observed: hexagonal ( ⫽60°), square ( ⫽90°), and rhombic (90°⬎ ⭓65°). The observations were compared to the results from Dubin,23 who performed an analytic calculation of the energies of lattice planes that are infinite and homogeneous in the 共x,y兲 direction but are confined in the axial direction by a harmonic external electrostatic confinement potential, e ⫽1/2(m/e) z2 z 2 . Since this potential is identical to the confinement potential of a Penning trap, as seen in the rotating frame in the ␣ →0 planar limit, the minimum energy phase structures predicted by the theory should match the structures observed in the central regions of the oblate plasmas of the experiments. Figure 6 displays the agreement between theory and experiment for the interlayer quantities, with measurements taken on different plasmas with N⬍104 . Lengths have been normalized by a WS2-D⫽(3e 2 /4 ⑀ 0 m z2 ) 1/3⫽10.7 m, which is the Wigner–Seitz radius in the planar limit. As the central areal density is increased, the lattice planes move farther apart axially in order to match their average density to the neutralizing background. Eventually it becomes energetically favorable to form an additional lattice plane. The symbols indicate whether the lattices had an interlattice displacement vector c2 characteristic of the hexagonal phase 共triangles兲 or the square and rhombic phases 共squares兲. Figure 7 displays the agreement between experiment and theory for the dependence of the angle 共between the primitive vectors兲 on central areal charge density . The trend is
Crystalline order in laser-cooled, non-neutral ion . . .
11
FIG. 6. Interlayer structure 共plane axial positions and displacement vectors兲 as a function of normalized areal charge density. The lines are the predictions of theory, and the symbols are experimental measurements.
that when a new lattice plane is formed, changes discontinuously from ⬇60° to a higher value. As the central areal density of the crystal is further increased, smoothly decreases to ⬇65° until there is a second discontinuous transition to a hexagonal structure. This latter transition has been predicted32 to become continuous in liquid (⌫⬍80) bilayer systems. The lines indicate the minimum energy structures predicted by the 2-D theory. IV. DISCUSSION
With Bragg scattering and spatial imaging, we have measured the correlations in both highly oblate and spherical strongly coupled 9Be⫹ ion plasmas. The planar geometry permits a detailed comparison with theoretical calculations. We have measured the preferred lattice structures for up to five lattice planes in lenticular plasmas and obtain good agreement with theory. By increasing the number of planes 共by adding more ions to the plasma兲, the transition from
FIG. 7. Intralayer angle structure as a function of normalized areal charge density. The lines are the predictions of theory, and the symbols are experimental measurements. Representative error bars are included with some of the measurements.
Downloaded 28 Sep 2001 to 132.163.136.56. Redistribution subject to AIP license or copyright, see http://ojps.aip.org/pop/popcr.jsp
12
Bollinger et al.
Phys. Plasmas, Vol. 7, No. 1, January 2000
FIG. 8. Five-fold Bragg scattering and real-space patterns obtained by strobing the intensified CCD camera synchronously with the rotating electric field perturbation. 共a兲 A Bragg scattering pattern obtained on an N⬃1.2 ⫻105 ion plasma phase locked with a rotating dipole field at r ⫽2 ⫻166.84 kHz. Here V 0 ⫽500 V and ␣ ⫽2.6. 共b兲 Real-space image of a lenticular plasma consisting of four horizontal planes in the plasma center. The rotating dipole field was used to set r ⫽2 ⫻74.35 kHz.
surface-dominated to bulk behavior in the planar geometry can be studied. Ions in a trap have been proposed as a register for a quantum computer.33 Work in this area has focused on a string of a few ions in a linear Paul trap.34 A single lattice plane of ions as in Fig. 5 could provide a 2-D geometry of trapped ions for studies of quantum computing or entangled quantum states. In spherical plasmas with more than 2⫻105 ions, we have observed the formation of bcc crystals, the predicted state for the infinite strongly coupled OCP. The crystals occupied the inner quarter of the plasma diameter. Outside the crystal there was a complicated transition to a shell structure. In this system we have not observed the thermodynamic liquid–solid phase transition predicted for the bulk OCP. Our measurements have concentrated on the correlations obtained at the coldest temperatures 共therefore maximum ⌫兲 where the ion fluorescence is maximum. The phase transition may take place in the present system, but we have experimentally missed detecting it, or possibly larger crystals 共for example, where the number of ions in the crystal is large compared to the number of ions in the shells兲 may be required in order for a sharp phase transition to be exhibited. We have observed structures for which we do not have a good current theoretical understanding. Figure 8共a兲 shows an approximate five-fold Bragg scattering pattern that was observed a number of times under different experimental circumstances. A five-fold Bragg scattering pattern is characteristic of a quasicrystal. However, more sets of dots would be present in a true quasicrystalline Bragg scattering pattern. We now think that the five-fold Bragg scattering pattern of Fig. 8共a兲 is due to a structure like that shown in Fig. 8共b兲. Figure 8共b兲 is a top-view image of a lenticular plasma that consisted of four horizontal planes. Even though it is difficult to distinguish individual ions in this figure, it is possible to see that there are five distinct regions where the ions resided in vertical planes. The planes from these different regions form a five-sided structure that would produce a Bragg scattering pattern like Fig. 8共a兲. 共With the small crystals and forward Bragg scattering angles of this work, each set of vertical planes produces two Bragg peaks.兲 Once formed, this five-fold structure was stable and persisted for reasons that we do not understand.
In addition to enhancing studies of Coulomb crystals, the phase-locked control of r has improved the prospects of a microwave frequency standard based on a hyperfine-Zeeman transition of ions stored in a Penning trap. This is because the time–dilation shift due to the plasma rotation is one of the largest known systematic shifts in such a standard. In Ref. 35, the potential frequency stability and accuracy of a microwave frequency standard based on 106 trapped ions is discussed. For ions such as 67Zn⫹ and 201Hg⫹, fractional frequency stabilities ⱗ10⫺14/ 1/2 with time–dilation shifts due to the plasma rotation of ⬃few⫻10⫺15 are possible. Here is the measurement time in seconds. With phaselocked operation of the rotating wall, we think it should be possible to stabilize and evaluate the rotational time–dilation shift within 1%. Therefore the inaccuracy due to this shift would contribute a few parts in 10⫺17. ACKNOWLEDGMENTS
We thank S. L. Gilbert and R. J. Rafac for their comments and careful reading of the manuscript. We gratefully acknowledge the support of the Office of Naval Research. 1
J. J. Bollinger, T. B. Mitchell, X.-P. Huang, W. M. Itano, J. N. Tan, B. M. Jelenkovic, and D. J. Wineland, in Trapped Charged Particles and Fundamental Physics, edited by D. H. E. Dubin and D. Schneider 共American Institute of Physics, New York, 1999兲, pp. 295–304. 2 T. B. Mitchell, J. J. Bollinger, X.-P. Huang, W. M. Itano, and D. H. E. Dubin, Phys. Plasmas 6, 1751 共1999兲. 3 S. Ichimaru, H. Iyetomi, and S. Tanaka, Phys. Rep. 149, 91 共1987兲. 4 J. H. Malmberg and T. M. O’Neil, Phys. Rev. Lett. 39, 1333 共1977兲. 5 H. M. Van Horn, Science 252, 384 共1991兲. 6 C. C. Grimes and G. Adams, Phys. Rev. Lett. 42, 795 共1979兲. 7 E. L. Pollock and J. P. Hansen, Phys. Rev. A 8, 3110 共1973兲; W. L. Slattery, G. D. Doolen, and H. E. DeWitt, ibid. 21, 2087 共1980兲; W. L. Slattery, G. D. Doolen, and H. E. DeWitt, ibid. 26, 2255 共1982兲; S. Ogata and S. Ichimaru, ibid. 36, 5451 共1987兲; G. S. Stringfellow and H. E. DeWitt, ibid. 41, 1105 共1990兲; D. H. E. Dubin, ibid. 42, 4972 共1990兲. 8 J. P. Schiffer, Science 279, 675 共1998兲. 9 F. Diedrich, E. Peik, J. M. Chen, W. Quint, and H. Walther, Phys. Rev. Lett. 59, 2931 共1987兲. 10 D. J. Wineland, J. C. Bergquist, W. M. Itano, J. J. Bollinger, and C. H. Manney, Phys. Rev. Lett. 59, 2935 共1987兲. 11 Strongly coupled clusters of highly charged, micrometer-sized aluminum particles were previously observed in Paul traps. See R. F. Wuerker, H. Shelton, and R. V. Langmuir, J. Appl. Phys. 30, 342 共1959兲. 12 S. L. Gilbert, J. J. Bollinger, and D. J. Wineland, Phys. Rev. Lett. 60, 2022 共1988兲. 13 G. Birkl, S. Kassner, and H. Walther, Nature 共London兲 357, 310 共1992兲. 14 M. Drewsen, C. Broderson, L. Hornekaer, J. S. Hangst, and J. P. Schiffer, Phys. Rev. Lett. 81, 2878 共1998兲. 15 H. Walther, Adv. At., Mol., Opt. Phys. 31, 137 共1993兲. 16 A. Melzer, A. Homann, and A. Piel, Phys. Rev. E 53, 2757 共1996兲. 17 C. A. Murray and D. G. Grier, Am. Sci. 83, 238 共1995兲. 18 W. L. Vos, M. Mehens, C. M. van Kats, and P. Bo¨secke, Langmuir 13, 6004 共1997兲. 19 J. N. Tan, J. J. Bollinger, B. Jelenkovic´, and D. J. Wineland, Phys. Rev. Lett. 75, 4198 共1995兲. 20 W. M. Itano, J. J. Bollinger, J. N. Tan, B. Jelenkovic´, X.-P. Huang, and D. J. Wineland, Science 279, 686 共1998兲. 21 X.-P. Huang, J. J. Bollinger, T. B. Mitchell, and W. M. Itano, Phys. Rev. Lett. 80, 73 共1998兲. 22 X.-P. Huang, J. J. Bollinger, T. B. Mitchell, and W. M. Itano, Phys. Plasmas 5, 1656 共1998兲. 23 T. B. Mitchell, J. J. Bollinger, D. H. E. Dubin, X.-P. Huang, W. M. Itano, and R. H. Baughman, Science 282, 1290 共1998兲. 24 L. R. Brewer, J. D. Prestage, J. J. Bollinger, W. M. Itano, D. J. Larson, and D. J. Wineland, Phys. Rev. A 38, 859 共1988兲.
Downloaded 28 Sep 2001 to 132.163.136.56. Redistribution subject to AIP license or copyright, see http://ojps.aip.org/pop/popcr.jsp
Phys. Plasmas, Vol. 7, No. 1, January 2000 R. C. Davidson, Physics of Non-neutral Plasmas 共Addison-Wesley, New York, 1990兲, pp. 39–75. 26 T. M. O’Neil and D. H. E. Dubin, Phys. Plasmas 5, 2163 共1998兲. 27 D. J. Heinzen, J. J. Bollinger, F. L. Moore, W. M. Itano, and D. J. Wineland, Phys. Rev. Lett. 66, 2080 共1991兲. 28 J. J. Bollinger, D. J. Heinzen, F. L. Moore, W. M. Itano, D. J. Wineland, and D. H. E. Dubin, Phys. Rev. A 48, 525 共1993兲. 29 D. H. E. Dubin, Phys. Rev. A 40, 1140 共1989兲. 30 N. W. Ashcroft and N. D. Mermin, Solid State Physics 共Saunders, Philadelphia, 1976兲, pp. 95–110. 31 J. N. Tan, J. J. Bollinger, B. Jelenkovic´, W. M. Itano, and D. J. Wineland, 25
Crystalline order in laser-cooled, non-neutral ion . . .
13
in Proceedings of the International Conference on Physics of Strongly Coupled Plasmas, edited by W. D. Kraeft and M. Schlanges 共World Scientific, Singapore, 1996兲, pp. 387–396. 32 V. I. Valtchinov, G. Kalman, and K. B. Blagoev, Phys. Rev. E 56, 4351 共1997兲. 33 J. I. Cirac and P. Zoller, Phys. Rev. Lett. 74, 4091 共1995兲. 34 D. J. Wineland, C. Monroe, W. M. Itano, D. Leibfried, B. E. King, and D. M. Meekhof, J. Res. Natl. Inst. Stand. Technol. 103, 259 共1998兲. 35 J. N. Tan, J. J. Bollinger, and D. J. Wineland, IEEE Trans. Instrum. Meas. 44, 144 共1995兲.
Downloaded 28 Sep 2001 to 132.163.136.56. Redistribution subject to AIP license or copyright, see http://ojps.aip.org/pop/popcr.jsp