PHYSICS OF PLASMAS
VOLUME 8, NUMBER 3
MARCH 2001
Striation phenomenon in the plasma display panel Chae Hwa Shon and Jae Koo Leea) Department of Electrical Engineering, Pohang University of Science and Technology, Pohang 790-784, South Korea
共Received 17 July 2000; accepted 8 December 2000兲 A detailed analysis, based on kinetic and fluid simulations, of striation phenomenon in the plasma display panel cell has been presented. Numerical studies indicate that the phenomenon of striation occurs primarily due to the accumulation of space charge near the anode electrode. These space charges locally create multiple-layer potential distribution near the anode region. The ion density in the vicinity of this region groups up due to ionization processes, which are caused by electron species. However, the electrons are further attracted by the anode. Well-like deformations occur in the anode potential distribution, which confine electrons and produce density humps. On the contrary, cathode plasma density depends on the secondary-electron emission by ions that are attracted to the anode dielectric surface. © 2001 American Institute of Physics. 关DOI: 10.1063/1.1345708兴
I. INTRODUCTION
curs continuously at the cathode and striations are found on the anode side.2 Striations in the PDP cell are stationary so that the density humps do not move with time.1,3 The discharge starts from the inner edge of the anode electrode and density humps occur sequentially from the inner to outer anode region. The density humps are isolated from each other and the depth from the front panel is shallow. The Xe emission is stronger than the Ne one in the striations. The striation channel distance 共pitch between plasma density humps兲 depends on the gas pressure and compositions.3 One of the proposed explanations is that this phenomenon occurs due to the ion surface-charge fluctuation on the cathode dielectric surface. The ion surface-charge fluctuation that is caused by the applied potential and accumulated electron surface charge on the anode dielectric makes the striations of ion density humps at the next pulse 共reversed applied voltage pulse兲 time. Because of previous electron charges on the anode and fluctuated distribution of ion charges on the cathode, discharges that make striations occur along the fluctuated ion surface-charge profiles.2 Another explanation by the NEC group3 is based upon experimental observation of the excited-species emission spectrum. In their experiment, fluctuations of excited species on the cathode side were not detected with time. Instead, the time sequence of the anode side striations of the excited species from the inner edge of the anode to the outer edge of the anode was observed. From these results, it was proposed that, possibly, electrons are accumulated rapidly in the temporal anode region where emission starts. The surface charge generates a distorted electric field in combination with the anode potential. Finally, a discharge channel forms between the electron accumulation area and some point along the field. The channel distance depends on the gas condition. As the PDP system is very small, it is difficult to diagnose such a system with the help of experiments. Hence simulation has been widely used for the PDP system. It is possible to obtain various plasma characteristics easily from simulations and to investigate the discharge physics inside
The plasma display panel 共PDP兲 has been one of the most promising candidates for the next generation of high definition display devices. Recently, there has been a considerable attempt to disseminate PDP technology because of its numerous advantages over the other display devices. Much work has been in progress to enhance the working efficiency of the PDP cell in order to be able to supersede other display devices. However, there have been several fundamental, as well as technological issues, which need more careful attention to resolve. These include cost reduction, luminous efficiency improvement, power reduction, driving method, and others. Likewise, one of the most fundamental and important issues is the understanding of the discharge mechanism. In this paper, we would like to concentrate on this subject. Our prime endeavor here is to understand the phenomenon of striation, which occurs during the discharge phase in the PDP cell. Striation has been reported by several experiments,1–3 but not by simulations.4–10 Positive column striation phenomena have been observed in several glow discharge experiments.11–13 The origin of positive column striations is known to be ion acoustic waves due to the propagating perturbations, but the discharge without a positive column in the PDP cell has different characteristics. The characteristics of striations from the PDP experiments are as follows. Striation is observed in the systems that have electrodes covered by dielectric materials. Even though there are dielectric materials on the electrodes, striation phenomena do not occur in the matrix-type PDP cells and in the systems that have an angle smaller than 50° between the two sustain electrodes. Striations are dependent on the pressure of neutral gas inside the PDP cell. The pitch between the plasma density humps becomes shorter as the pressure is relatively high. The discharge occurs from the center and expands outward as time advances. The discharge glow oca兲
Electronic mail:
[email protected]
1070-664X/2001/8(3)/1070/11/$18.00
1070
© 2001 American Institute of Physics
Downloaded 15 Mar 2001 to 141.223.180.14. Redistribution subject to AIP copyright, see http://ojps.aip.org/pop/popcpyrts.html
Phys. Plasmas, Vol. 8, No. 3, March 2001
Striation phenomenon in the plasma display panel
1071
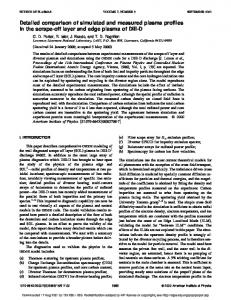
FIG. 1. Schematic diagram of the PDP cell used in the simulation.
the cell. In this report, we obtain time development data of striations and try to understand the possible mechanism behind this phenomenon. We follow various profiles 共plasma densities, surface charges, electric field, and potential兲 of the PDP cell with time to explain the phenomena. Striation phenomena can be clearly observed in the results of kinetic simulation. The striations occur in the anode side only and we cannot find wave-like fluctuations of ion surface charge on the cathode side which can make a plasma density fluctuation at the next pulse. Contrarily, we observe electron surface-charge fluctuations on the anode dielectric surface. As we start simulation without pre-accumulated surface charges, the observed striations are not caused by the previous surface charges. The electron surface charges change the potential, which makes the striations. We observe the sequential development of plasma density humps along anode dielectric from the inner to the outer edge of the anode. During this process, several well-like potentials that confine plasma bunches are formed on the anode surface. These fine
FIG. 3. Time traces of the numbers of plasma particles and observation points of Figs. 14 and 15. The solid line is Xe ion, the dotted one is electron, and the dashed one is Ne ion numbers.
FIG. 2. The cross sections used in kinetic simulation for 共a兲 Xe gas and 共b兲 Ne gas.
FIG. 4. Striations in the various pressure systems at 共a兲 100 Torr, 共b兲 200 Torr, and 共c兲 500 Torr.
structures are maintained until the number of electron particles reaches a peak value, which can cancel the applied voltage on the anode. In Sec. II, simulation results by kinetic and fluid codes are given. Discussion and a detailed explanation of striations are reported in Sec. III. Section IV contains the summary and conclusions. II. SIMULATION RESULTS A. Simulation domain and conditions
The geometry of PDP simulation is presented in Fig. 1. The cell structure is based on coplanar geometry and the size of each component is depicted in the figure. Two sustain electrodes are located in the front panel and are covered by dielectric material, and one address electrode is located in the rear panel along the x direction. The length of the PDP cell is
Downloaded 15 Mar 2001 to 141.223.180.14. Redistribution subject to AIP copyright, see http://ojps.aip.org/pop/popcpyrts.html
1072
Phys. Plasmas, Vol. 8, No. 3, March 2001
C. H. Shon and J. K. Lee
FIG. 5. 共a兲 Time trace of plasma particles and potential profiles 共b–f兲 at the times depicted in the time trace 共a兲 under 100 Torr neutral gas pressure.
1260 m and the width is 210 m. The gap between two sustain electrodes along the x direction is 60 m and the length of each sustain electrode is 400 m. The width and relative dielectric constant of the dielectric materials are, respectively, 45 m, 12, and 40 m, 10 for each front and rear panel. The applied voltages are, respectively, 300, 0, 150 V for each left, right sustain electrodes, and address electrode. The pressures used in the study are 100, 200, and 500 Torr. The neutral gas composition is 96% Ne and 4% Xe. We use the OOPIC10 code as a kinetic simulator. As kinetic simulation needs considerably more time, as compared with the fluid simulation, we simulate only for a short time period. In addition to the kinetic simulation, we also present the results obtained from a fluid code4 to compare the discharge development. The simulation conditions are as follows. The initial densities of the kinetic code are 1016/m3 for electrons and ions and initial simulation particle numbers are 1574, 1512, 62 for electrons, Ne ions, and Xe ions in the cell. The initial densities in the fluid code is 1012/m3 for electrons and ions. The time step of the kinetic code is fixed to 10⫺13 to satisfy the Courant–Friedrichs–Lewy condition. The time step of the fluid code can be changed with the discharge evolution because the code uses an implicit method to shorten the time
step. The initial time step of fluid simulation is 10⫺11. The initial density in the kinetic code is higher than in fluid to provide enough simulation particle numbers in the cell. The number of grids is 63 for the x direction and 42 for the y direction. When the discharge reaches the peak, the total simulation particle number becomes one million in kinetic simulation. The minimum Debye length ( D) of the peak plasma density is about 1.2 m 共kinetic code result兲. The secondary emission coefficients of the dielectric surface are 0.5 for Ne ion and 0.05 for Xe ion in the kinetic and fluid simulation. The Monte Carlo collision method is used for the electron–neutral, ion–neutral collisions in kinetic simulation. The discharge includes electron–neutral elastic, excitation, and ionization collisions, as well as ion–neutral charge–exchange collisions. The cross sections of Ne and Xe gases used in the kinetic code are shown in Fig. 2. B. Striations in kinetic simulations
Almost all PDP simulation codes use drift-diffusion approximation 共fluid codes兲. The approximation has a limitation in the sheath region in which the electric field is high.6 As the kinetic simulation does not possess such an assumption, it treats the sheath region with relatively better accu-
Downloaded 15 Mar 2001 to 141.223.180.14. Redistribution subject to AIP copyright, see http://ojps.aip.org/pop/popcpyrts.html
Phys. Plasmas, Vol. 8, No. 3, March 2001
Striation phenomenon in the plasma display panel
1073
FIG. 6. Electron density profiles at the times of Fig. 5共a兲 under 100 Torr neutral gas pressure.
racy. But because the density of plasma particles is high in the PDP system, much time is needed to observe the time development of a discharge with the kinetic code. Until now the observation of striation phenomena by the fluid 共driftdiffusion兲 simulation has not been reported. Figure 3 is a time trace of plasma particle numbers in the PDP cell. The arrows indicate the time period during which the observations of Figs. 5–10 are being made. As shown in Fig. 4, striations are clearly observed in the kinetic simulations. A wide density hump is located near the inner edge of the anode and extended to the cathode. The other small density humps are aligned along the anode electrode. The heights of humps on the anode become low from center to the outer edge of the anode, but the sizes of density humps are nearly the same. The highly nonuniform distributions of the plasma indicate that the major light production of species Xe* develops at the same positions of plasma distributions and produces striations in the PDP cell. The dependence of striations on different pressures has also been obtained in the simulation 共Fig. 4兲 and the results show the same trend as observed in the experiments. As the pressure of the system becomes higher, the number of density humps increases and the distance between peaks becomes smaller. However, the last hump appears at the outer edge of the anode regardless
of the neutral gas pressure inside the cell. After the occurrence of the last hump, the total electron number in the cell reaches the peak value and the discharge starts to extinguish. C. Plasma distribution with time
We follow the time trace of several physical quantities to observe how these density humps develop with time. Figure 5 shows the time development of potential profiles and plasma particle numbers in the cell. The plasma properties are observed at five different times, twice before number peak, Xe ion and electron number peak times, and a time after number peak, as indicated by the arrows in Fig. 5共a兲. Plasma density distributions are shown in the next figures, electrons in Fig. 6, Xe ions in Fig. 7, and Ne ions in Fig. 8 at the same observation points. The discharge initiates from the inner edge of the anode electrode and moves toward the cathode surface. The wide and flat potential between anode and cathode in Fig. 5共b兲 is the first plasma density-hump region where the largest plasma density appears 关Figs. 6共b兲, 7共b兲, and 8共b兲兴. The next flat potential region appears in Fig. 5共b兲 near the anode dielectric surface. At this time, the second density hump appears in the next flat potential region. As time advances, the potential deforms more, as shown in Fig.
Downloaded 15 Mar 2001 to 141.223.180.14. Redistribution subject to AIP copyright, see http://ojps.aip.org/pop/popcpyrts.html
1074
Phys. Plasmas, Vol. 8, No. 3, March 2001
C. H. Shon and J. K. Lee
FIG. 7. Xe⫹ density profiles at the times of Fig. 5共a兲 under 100 Torr neutral gas pressure.
5共c兲. One more plasma density hump appears at this time and the peak occurs in the flat potential region, too. The third plasma density’s peak value is smaller than that of the second peak. This can be explained by the potential profiles. The electrons moving to the outer edge of the anode ionize the neutral gas by gaining the energy from the potential difference. But as we see in Figs. 5共b兲 and 5共c兲, the potential difference between the humps becomes smaller as we go to the outer edge of the anode. When the last hump occurs and the density humps supply enough surface charges to cancel the applied potential, discharge extinguishes and the potential of the anode becomes flat in Figs. 5共d兲–5共f兲. Even after the time of occurrence of the Xe⫹ number peak, the electron number increases as shown in Fig. 5共a兲. This is because of the well-like potential in the space between peaks. As in Fig. 5共d兲, the anode surface potential is nearly flat, but the potential fluctuations still remain in the space. The electron number increases more than the Xe⫹ number by these potential fluctuations. Surface charges on the front dielectric surface are very important to operate the PDP cell. When the applied voltages are flipped over, the total voltage difference between sustain electrodes becomes higher than the applied one because the surface charges that are accumulated in the previous pulse
time provide an additional voltage difference. Therefore, the PDP cell can be sustained with lower voltage than the firing voltage that is needed to ignite the discharge. Besides, surface charges drastically affect the discharge in the PDP cell, e.g., extinguishment of discharge and sustain voltage. It is difficult to diagnose the spatial profiles of surface charges in the cell experimentally. The surface charges from kinetic simulation are shown in Fig. 9. We can observe fine structures of surface charges, especially electrons. There are no fine structures of ion surface charges on the cathode– electrode dielectric surface. On the anode side, we can observe many peaks of surface charges. As time advances, the surface charge structures follow the plasma density fluctuations in the space. This means that plasma particles respond self-consistently due to the combined electric field of the applied and surface charge potential. The total surface charges and potentials along the front dielectric material are shown in Fig. 10. Each line represents the result of different observation time. Total surface-charge density has fluctuations on the anode surface while the discharge develops, but becomes flat after the number peaks up. Surface charges on the cathode mainly consist of ions and do not exhibit any fluctuations. The surface charge profile changes followed by the potential distributions. The poten-
Downloaded 15 Mar 2001 to 141.223.180.14. Redistribution subject to AIP copyright, see http://ojps.aip.org/pop/popcpyrts.html
Phys. Plasmas, Vol. 8, No. 3, March 2001
Striation phenomenon in the plasma display panel
1075
FIG. 8. Ne⫹ density profiles at the times of Fig. 5共a兲 under 100 Torr neutral gas pressure.
tials on the dielectric surface, 10 m below, and 20 m below the dielectric surface are shown in Figs. 10共c兲, 10共d兲, and 10共e兲. As time progresses, the anode potential becomes flat and low. The space potential follows the surface potential changes. The first flat potential appears in the first bulk region in the cell. The next flat potential region appears in the next plasma density-hump region and striation develops there. The potential difference between the flat and applied potential is higher than the ionization voltage of neutral gas. In this high electric-field region, electrons obtain sufficient energy to ionize the neutral gas and make another density hump in the cell. This process continues until the applied potential becomes low and flat. The development of Xe⫹ distributions caused by the energetic electrons are shown in Fig. 10共b兲. The peaks appear in the flat potential regions. These multiple layers of potential make the nonuniform plasma distributions which can cause striations. We will discuss this mechanism in detail in the next section. The surface potential becomes flat when the Xe⫹ number peaks up, but the space potential has small well-like potential fluctuations until the electron number peaks. These fluctuations confine and produce electrons in the space. As a comparison with experimental results of the vacuum ultraviolet 共VUV兲 emission spectrum, the time development of plasma density contours at 500 Torr is shown
in Fig. 11. We observe that the density humps develop from the anode inner edge to outer edges of electrodes as time progresses. The appearing speed of local peaks along the anode electrode and the speed of the first peak progress can be calculated from Fig. 11. We calculate the speeds from the electron contours and compared with the results of NEC.3 The progressing speeds of peaks and the first peak are about 7.80, 1.35 km/s from the simulation and 7.50, 2.0 km/s from the experiment. Though the conditions of the system are different, the orders of magnitude are the same, which shows an excellent agreement between simulation and experiment. In the VUV experiment,14 two large density humps were observed in the PDP cell with time. The results did not show the striation on the anode which appeared in NEC’s results. It may originate from the spatial resolution of the device that measures the VUV or the different system conditions. Striations are the superset of the two density humps which appeared in the previous experiment and show fine structures of discharge on the anode surface. D. Fluid simulation results
Usual fluid simulation uses a drift-diffusion approximation that does not follow the kinetics of each particle. If the striations originate from the kinetic effects, as the electric
Downloaded 15 Mar 2001 to 141.223.180.14. Redistribution subject to AIP copyright, see http://ojps.aip.org/pop/popcpyrts.html
1076
Phys. Plasmas, Vol. 8, No. 3, March 2001
C. H. Shon and J. K. Lee
FIG. 9. Surface charge density profiles along the front dielectric surface at the times of Fig. 5共a兲 under 500 Torr neutral gas pressure.
field curvatures, these cannot be observed in fluid simulations. We execute a fluid simulation with the same geometry and conditions using fluid code.4 The model consists of continuity equations for electrons and ions, Poisson’s equation, and momentum equation with local field approximation. The excited neutral species are followed by the continuity equations. The Xe* density is obtained by calculating electron impact excitation and several chemical reactions. The Xe* species are lost by chemical reactions, UV radiation, and diffusion to the walls. We present the fluid simulation results in Figs. 12 and 13. Shading represents plasma density contour and lines represent electric-field contour. Figure 12 is electron distribution and Fig. 13 is Xe excited state 共Xe*兲 density profiles that emit 147 nm VUV. Xe* density profiles do not differ much from the Xe⫹ density profiles, which means that the density humps of Xe* occur in the same way as Xe⫹ density. As we observe in the figures, striations occur in the fluid simulation, too. Striations are not clear in fluid simulation because localization of the density humps is not strong enough and the humps smear out faster than those of kinetic simulation. The progress of the discharge differs little between the fluid and kinetic simulations. It can be observed from the electron distributions that electrons in fluid simulation move faster toward the outer edge of the anode than those in kinetic simulation. The second electron density
hump occurs before first hump’s reaching to the cathode dielectric in the fluid simulation. We have not found the localized electric field in the fluid simulation. This indicates that ion densities are smeared out at a faster rate, so that spatial localization of the electric field is weaker in the fluid simulation. III. DISCUSSION
Striations are the localized plasma density humps appearing near the anode side. We have presented the localization of plasma distribution with time. To explain the striation phenomenon self-consistently, the evolution of initial discharge profiles are shown in Figs. 14–16. The profiles in Figs. 14–16 are obtained in the early phases of the discharge that are indicated as arrows in Fig. 3. The time interval of each figure is 5 ns in Figs. 14 and 15. The evolutions of electron and potential are shown in Fig. 14. The electron density starts to develop from the inner anode edge as shown in Fig. 14共a兲. As time progresses, the electrons move toward the cathode electrode and then stretch to the inner edge of the anode surface 关Figs. 14共a兲–14共e兲兴. Figure 14共f兲 shows the appearance of another electron density hump. Xe ions are more widely spread than electrons between the two sustain electrodes at the first time 关Fig. 15共a兲兴. The ions, produced by electron ionization, are pulled toward the cathode side and emit secondary electrons. Elec-
Downloaded 15 Mar 2001 to 141.223.180.14. Redistribution subject to AIP copyright, see http://ojps.aip.org/pop/popcpyrts.html
Phys. Plasmas, Vol. 8, No. 3, March 2001
Striation phenomenon in the plasma display panel
1077
FIG. 10. 共a兲 Total surface charge density profiles with time on the front-dielectric surface, 共b兲 Xe⫹ density profiles 10 m below dielectric surface, 共c兲 potential profiles on the dielectric surface, 共d兲 potential density profiles 10 m below dielectric surface, 共e兲 potential density profiles 20 m below the dielectric surface. The times of t1, t2, and t3 correspond to the first, second, and fifth arrows in Fig. 5共a兲.
tron and ion density humps move toward the cathode side by this process. As we notice from Fig. 15共e兲, another small ion hump develops prior to the electron hump 关Fig. 14共f兲兴 in the anode side. This hump is produced by the energetic electrons moving toward the applied potential from the bulk plasma. The second localized density hump is produced by the selfconsistent response of plasma to the electric field of the applied and surface charge potentials. The self-consistent time evolutions of surface charges, potential and electron density distribution are presented in Fig. 16. We investigate the lines along the dielectric surface at different y positions that consist of the front dielectric surface and 20 m below the dielectric surface. The time interval between the lines is 10 ns. The times 共t1, t2, t3兲 in Fig. 16 correspond to Fig. 14共b兲, 14共d兲, and 14共f兲. As the discharge develops, the electron surface charge increases and the applied potential decreases near the inner edge of the anode 关Fig. 16共a兲兴. The electron surface charge shows a fine structure on the anode, which indicates the evolution of discharge. Accumulated electron surface charges compensate for the applied voltage and prevent the electron incidence to the surface. The density of the second electron hump increases as the discharge moves to the cathode. In this process, the space electrons make the potential flat near the anode edge. There occurs temporal double-layer potential between the applied potential and the local plateau on the dielectric surface 共t2兲. The electron and ion fluxes to the surface are shown in Figs. 16共b兲 and 16共c兲. The ion density
on the anode is much higher than that of the electron, which supplies secondary electrons to the bulk plasma. After formation of the first bulk plasma and potential plateau, the electron can obtain sufficient energy to ionize the neutral gas by the potential difference 共about 50 V in Fig. 16兲 between the plateau and anode. The second density hump develops around the high potential-slope region due to electrons that obtain sufficient energy to ionize neutral gas in this region. But ions are repelled by the potential slope so that the first hump ions are separated from the second hump. Electrons in the second density hump make the third electron surface-charge peak 关Fig. 16共a兲兴. The Xe⫹ density in the space 共20 m兲 becomes higher than electrons and an ion-rich high potential peak appears at the second density hump region in the space as in Figs. 16共d兲 and 16共e兲. This potential will work as the potential well for electrons and make high density bulk plasma by the electron confinement. If the density of the second localized density hump reaches a certain amount, the same procedure repeats itself. The sufficient electron surface charges, produced by the density humps, modify the electric field and potential. This process is repeated until the applied potential becomes flat 共Fig. 10兲. The density humps are created until the discharge reaches the left edge of the anode. If the electron surface charges cover the entire region of the anode electrode, the electrons cannot obtain sufficient energy for ionization from the applied potential and the discharge starts to extinguish. The plasma density in the cell decreases from this time 共Fig.
Downloaded 15 Mar 2001 to 141.223.180.14. Redistribution subject to AIP copyright, see http://ojps.aip.org/pop/popcpyrts.html
1078
Phys. Plasmas, Vol. 8, No. 3, March 2001
C. H. Shon and J. K. Lee
FIG. 11. Propagation of density contours of 共a兲 electron, 共b兲 Xe⫹ , 共c兲 Ne⫹ with time at the pressure of 500 Torr.
6兲. But even after the flattening of the surface potential, the space potential has small fluctuations and confines the electron species in small hump regions 关Figs. 5共d兲, 5共e兲, 10共d兲, and 10共e兲兴 because the potential fluctuations are comparable or higher than the average value of the known electron temperature of the PDP system, which is around 1 eV. The space potential becomes flat by the diffusion of plasma particles, but the density humps are maintained even after the peak plasma particle number, as in Figs. 5共e兲, 6共e兲, and 10共b兲. The discharge mainly occurs by the ionization process in the anode region and by the secondary-electron emission process in the cathode region because ion flux to the cathode is much larger than to the anode. Ne⫹ flux to the cathode region is higher than the Xe⫹ because of mobility difference. But the situation is reversed in the anode region because Xe⫹ density is much larger than Ne⫹ density 共Fig. 9兲. Though there is a high E-field region between the first bulk plasma and the cathode region, ionization is not dominant in this region because electron density is very low compared with the anode region 关Figs. 5 and 6兴. The different mechanism of discharge produces a different evolution of plasma profiles in each sustain-electrode region. IV. SUMMARY AND CONCLUSION
We presented several physical quantities such as potential, electric field, and plasma density profiles in the cell to
understand the striation phenomenon self-consistently. Several results were consistent with experiment. Striation originated from a localized excited species density humps which produce visible light from phosphor by VUV emission. The number of density humps below the anode dielectric and sizes of density humps greatly depended on the pressure. As the pressure became higher, the size of the density humps became smaller. The bunches of density mainly occurred on the anode electrode near the dielectric surface except for a wide density hump on the cathode. The starting position of light emission or density hump occurred at the edge of the anode electrode and propagated to the outer edges of electrodes. The propagation time to the anode side was faster than the one to the cathode. The striations occurred only on the anode region, developed sequentially toward the outer anode edge, and stopped at the end of the anode electrode. The origin of the striations was the deformation of potentials by the surface charges 共mainly electrons兲 on the anode surface. The accumulated negative surface charges diminished the applied potential on the anode dielectric locally. The changed potential made another channel for energetic electrons to make the next plasma density hump and prevented the movement of previously developed plasma ions. Multiple-layer potential profiles oc-
Downloaded 15 Mar 2001 to 141.223.180.14. Redistribution subject to AIP copyright, see http://ojps.aip.org/pop/popcpyrts.html
Phys. Plasmas, Vol. 8, No. 3, March 2001
FIG. 12. Electron density profiles with time between the points of Fig. 3共a兲, 500 Torr pressure 共fluid simulation兲. Shading represents plasma density contour and lines represent the E-field contour.
curred temporally on the anode surface and in the cell near the anode-dielectric surface. The potential difference between the layers supplied electrons energy to make enough space and surface charges in this region, which canceled the
FIG. 13. Xe* ion density profiles and the potential contours in time between the points of Fig. 3共a兲, 500 Torr pressure 共fluid simulation兲.
Striation phenomenon in the plasma display panel
1079
FIG. 14. Electron density profiles and the potential contours in time between the points of Fig. 3共a兲, dt⫽5 ns, 500 Torr pressure 共kinetic simulation兲.
applied potential. The discharge mechanism near the anode surface was ionization by energetic electrons that obtained sufficient energy from the electric field between potential layers. Cathode discharge depended much on the secondary-
FIG. 15. Xe⫹ density profiles and the potential contours in time between the points of Fig. 3共a兲, dt⫽5 ns, 500 Torr pressure 共kinetic simulation兲.
Downloaded 15 Mar 2001 to 141.223.180.14. Redistribution subject to AIP copyright, see http://ojps.aip.org/pop/popcpyrts.html
1080
Phys. Plasmas, Vol. 8, No. 3, March 2001
C. H. Shon and J. K. Lee
FIG. 16. Time development of physical profiles at different positions and time between two points of Fig. 3共a兲, diagnostic time interval is 10 ns, and 500 Torr neutral gas pressure 共kinetic simulation兲. 共a兲 Electron surface charges 共right兲 and potential 共left兲 profiles, 共b兲 electron density 共right兲 and potential 共left兲 profiles on the dielectric surface, 共c兲 Xe⫹ density 共right兲 and potential 共left兲 profiles on the dielectric surface, 共d兲 electron density 共right兲 and potential 共left兲 profiles 20 m below dielectric surface, 共e兲 Xe⫹ 共right兲 and potential 共left兲 profiles 20 m below dielectric surface.
electron emission by the ion flux to the cathode-dielectric surface. ACKNOWLEDGMENTS
The authors would like to thank Dr. M. S. Hur, Dr. S. Dastgeer, Professor S. W. Cho, and Professor K. Tachibana for helpful discussions and suggestions. The present study was supported by LG Electronics and the Ministry of Education of Korea through its BK21 program. 1
H. Uchiike, Workshop Digest of the 18th Internal Display Research Conference (Asia Display ’98), Seoul, Korea, 1998 共Society for Information Display, 1998兲, p. 195. 2 G. Cho, E.-H. Choi, Y.-G. Kim, D.-I. Kim, H. S. Uhm, Y.-D. Joo, J.-G. Han, M.-C. Kim, and J.-D. Kim, J. Appl. Phys. 87, 4113 共2000兲. 3 T. Yoshioka, A. Okigawa, L. Tessier, and K. Toki, Proceedings of the Sixth International Display Workshop ’99, Sendai, Japan, 1999 共Society for Information Display, 1998兲, p. 603. 4 Y. K. Shin, C. H. Shon, W. Kim, and J. K. Lee, IEEE Trans. Plasma Sci. 27, 1366 共1999兲; Y. K. Shin, J. K. Lee, and C. H. Shon, ibid. 27, 14
共1999兲; Y. K. Shin, C. H. Shon, H. S. Lee, W. Kim, and J. K. Lee, Society for Information Display International Symposium Digest of Technical Papers, San Jose, CA, 1999 共Society for Information Display, 1999兲, p. 532. 5 S. Rauf and M. J. Kushner, J. Appl. Phys. 85, 3460 共1999兲; 85, 3470 共1999兲. 6 C. Punset, J. P. Boeuf, and L. C. Pitchford, J. Appl. Phys. 83, 1884 共1998兲. 7 H. S. Jeong, B. J. Shin, and K. W. Whang, IEEE Trans. Plasma Sci. 27, 171 共1999兲. 8 R. B. Campbell, R. Veerasingam, and R. T. McGrath, IEEE Trans. Plasma Sci. 27, 1366 共1999兲. 9 V. P. Nagorny, P. J. Drallos, and W. Williamson, Jr., J. Appl. Phys. 77, 3645 共1995兲. 10 J. P. Verboncoeur, A. B. Langdon, and N. T. Gladd, Comput. Phys. Commun. 87, 199 共1995兲. 11 L. Pekarek and V. Krejci, Czech. J. Phys., Sect. A 13, 881 共1963兲. 12 M. N. Hirsh and H. J. Oskam, Gaseous Electronics 共Academic, Orlando, FL, 1978兲, Chap. 2, Part 2.2, p. 65. 13 A. N. Lagarkov and I. M. Rutkevich, Ionization Waves in Electrical Breakdown of Gases 共Springer, New York, 1994兲, p. 185 . 14 C. K. Yoon, J. H. Seo, J. K. Kim, W. J. Chung, J. H. Yang, K. W. Whang, and H. S. Jeong, Society for Information Display International Symposium Digest of Technical Papers, San Jose, CA, 1999 共Society for Information Display, 1999兲, p. 272.
Downloaded 15 Mar 2001 to 141.223.180.14. Redistribution subject to AIP copyright, see http://ojps.aip.org/pop/popcpyrts.html