PROOF COPY 022104JDS
Miche`le Basseville e-mail:
[email protected]
Albert Benveniste Irisa, Campus de Ba´ulieu, 35042 Rennes Cedex, France
Maurice Goursat Inria, BP 105, 78153 Le Chesnay Cedex, France
Luc Hermans LMS International, Researchpark Haasrode Z1, Interleuvenlaan 68, 3001 Leuven, Belgium
PR
Laurnet Mevel Inria
Herman Van der Auweraer LMS International
Introduction
We address the problem of structural model identification during normal operating conditions and thus with uncontrolled, unmeasured, and nonstationary excitation. We advocate the use of output-only and covariance-driven subspace-based stochastic identification methods. We explain how to handle nonsimultaneously measured data from multiple sensor setups, and how robustness with respect to nonstationary excitation can be achieved. Experimental results obtained for three real application examples are shown. @DOI: 10.1115/1.1410919# Keywords: Subspace-Based Stochastic Identification Methods, In-Operation OutputOnly Structural Identification, Nonstationary Excitation, Multiple Sensor Setups
F
OO
1
Output-Only Subspace-Based Structural Identification: From Theory to Industrial Testing Practice1
CO
Before outlining the paper, we describe practical and conceptual motivations for output-only structural identification and for the proposed covariance-driven subspace-based algorithms.
• They allow to use in a much more efficient way the data measured during current product qualification or operation tests ~complement to running mode analysis!. • They can be used to improve in-laboratory measured modal models and adapt them to better reflect the actual system behavior in the operational situation. • They can be used to correlate with ~and ultimately improve! numerical ~such as FEM or other ‘‘white box’’! models of the system. • They can be used to monitor ~and diagnose! the system behavior ~and integrity/damage! during its normal operational life. • In the case of control systems ~e.g., ANVC, but also applicable to general process control!, the identification of the real in-operation behavior is essential to optimize the controller performance.
PY
1.1 Practical Motivations. Over the past decades, the identification of the dynamic properties of mechanical systems and structures has become a standard approach in the design process of a large number of products in many sectors. Experimental techniques such as modal testing and modal analysis have become available and are widely used. But most modal analysis techniques and procedures are limited to dedicated controlled laboratory tests where a low level excitation is applied and the corresponding system response is measured. Although forced excitation and correlated input-output measurements are, in principle, feasible in most operational conditions, testing complexity and achievable data quality render such an approach usually restricted to very dedicated applications. Examples are flight flutter testing with tipvane excitation @1,2#, or testing on rotating machinery using special electro-magnetic bearing excitation @3#. But there exist many structures for which controlled modal testing is not feasible: off-shore platforms subject to wave excitation, process plant piping systems subject to flow excitation, buildings, towers, and bridges subject to wind, traffic, and seismic excitations. Moreover, during real operation, the loading conditions may be substantially different from the ones used in the modal test. As all real world systems are to a certain extent nonlinear ~for example because of friction or clearance in connections, material characteristics, or because a specific nonlinear behavior is required, as with shock absorbers, . . . !, and since they are often also subject to nonlinear constraining conditions ~for example aeroelastic interaction of aircraft in flight!, the modal models obtained inlaboratory may fail to predict the correct system behavior, with all safety and comfort consequences. Therefore, a strong industrial need has been expressed for techniques extracting the system models under real operating condi-
tions. Although the modal analysis approach remains inherently linear, such in-operation techniques would allow to linearize the behavior around the loading conditions and for representative external constraints. The use of such in-operation models is multifold:
04
21
02
S
JD
1 This work has been supported by Eureka project no. 1562 SINOPSYS ~Model based Structural monitoring using in-operation system identification! coordinated by LMS, Leuven, Belgium. Contributed by the Dynamic Systems and Control Division for publication in the JOURNAL OF DYNAMIC SYSTEMS, MEASUREMENT, AND CONTROL. Manuscript received by the Dynamic Systems and Control Division February 7, 2001. Associate Editor: S. Fassois.
A practicable tool for structural dynamics analysis in an industrial environment should be able to deal with high order systems, with systems having a large number of outputs, with contaminated ~real! data and with nonstationary excitation. In this paper, we describe innovative elements of a tool having such capabilities, and resulting from the original combination of a covariance driven approach and a formulation for working with a limited number of references and with nonstationary excitation. The covariancedriven approach separates a first data reduction step from the identification step, and therefore allows long datasets and a large number of channels. Working with a limited number of references is made possible by the use of rectangular instead of square correlation matrices, and is a realistic way to deal with a large number of channels. 1.2 Conceptual Motivations. As compared to in-laboratory identification, in-operation identification raises the following new difficulties: • The ambient excitation under normal operating conditions is not measured and often nonstationary;
Journal of Dynamic Systems, Measurement, and Control Copyright © 2001 by ASME PROOF COPY 022104JDS
DECEMBER 2001, Vol. 123 Õ 1
PROOF COPY 022104JDS
H
• Sometimes the mass may vary during the experiment; a typical case is the Ariane V launcher example reported in Section 4.3.
F
OO
PR
These are two different issues. In the first one, the nonstationarity of the excitation is a nuisance against which the algorithms must be robust: if the structure does not change, output-only identification under nonstationary excitation should work as if the excitation was stationary. For the second issue, the identification algorithms must be able to track the change in structural behavior. In this paper, we mainly focus on the first issue. A particular problem arises when identification under nonstationary excitation is performed by using successive records collected from different sensor locations, this is referred to as multiple sensor setup in the sequel. It is known @4,5# that the modes and modeshapes of a structure coincide with the eigenstructure of a continuous time linear system driven by an excitation, and whose output vector is the set of accelerometer measurements. Because of what has been argued above, the key issue is to identify the eigenstructure in the presence of unmeasured and nonstationary natural excitation. This calls for the use of output-only identification methods @6#. This also calls for processing long samples of multi-sensor output measurements, and for using covariance-driven identification algorithms. As made clear below in a theoretical robustness result, and confirmed by the numerical results, the averaging operation underlying the covariance computation, in combination with the key factorization property of the covariances, allows to cancel out nonstationarities in the excitation. On the other hand, during the last decade there has been a growing interest in subspace-based linear system identification methods @7–9# and their relationship with instrumental variables ~IV! @10#. These methods are well suited for capturing the system eigenstructure. The purpose of this paper is to describe a class of output-only and covariance-driven subspace-based structural identification algorithms, which contains the BR- and CVA-algorithms; to explain how to extend these algorithms for handling non-simultaneously measured data from multiple sensor setups; to state a robustness property w.r.t. nonstationary excitation; and to report on numerical results obtained for three real application examples.
¨ ~ t ! 1CZ ˙ ~ t ! 1KZ~ t ! 5 n ~ t ! MZ Y ~ t ! 5LZ~ t !
(1)
where t denotes continuous time, M, C, K are the mass, damping, and stiffness matrices, respectively, ~high dimensional! vector Z collects the displacements of the degrees of freedom of the structure; the external ~nonmeasured! force n is modeled as a nonstationary white noise with time-varying covariance matrix Q n (t), measurements are collected in the ~often, low dimensional! vector Y, and matrix L states where the sensors are located. The modes or eigen-frequencies denoted generically by m, and the modeshapes or eigenvectors denoted generically by c m , are solutions of: det~ M m 2 1C m 1K ! 50,
c m 5LC m (2) Sampling the model in Eq. ~1! at rate 1/t yields the discrete time model in state space form:
H
~ M m 2 1C m 1K ! C m 50,
X k11 5FX k 1V k11 Y k 5HX k
(3)
where the state and the output are:
F G
Z~ k t ! X k5 ˙ , Y k 5Y ~ k t ! , Z~ k t !
(4)
M
Qn(s) M
X and observed output Y have dimensions 2m and r respectively, with r ~often much! smaller than 2m in practice. The whiteness assumption on the state noise, the absence of measurement noise in Eq. ~3!, and the dimensions, are further discussed in Section 4. We stress that sinusoidal or colored noise excitation can be encompassed as well @12#. The modal parameters defined in Eq. ~2! are equivalently found in the eigenstructure (l,F l ) of the state transition matrix F: e tm
PY
CO
the state transition and observation matrices are: F5e Lt , L 0 I 5 @ 2M 21 K 2M 21 C # , H5 @ L0 # , and where state noise V k11 is unmeasured, Gaussian, zero-mean, white, with covariance matrix: def T ) t Ls ˜ T Q k11 5 E(V k11 V k11 )5 * (kk11 e Q (s)e L s ds, where E(.) det ˜ (s)5 @ 00 0 21 notes the expectation operator and: Q 2T # . State
PROOF COPY 022104JDS
S
2 Õ Vol. 123, DECEMBER 2001
2.2 Output-Only Covariance-Driven Subspace-Based Identification. As mentioned, previously, processing output covariance matrices is of interest for very large data sets, especially under nonstationary excitation, and this is our main motivation for the covariance-driven subspace-based algorithms we describe now. The difference between the covariance-driven form of subspace algorithms which we describe and the usual data-driven form @8,9# is minor, at least for eigenstructure identification @11#. Covariance-driven subspace identification of the eigenstructure
JD
2.1 Modeling. The use of state-space representations for modal analysis is well known @4,5,11#. For the sake of notational convenience, we briefly recall the main equations and parameters. We assume that the behavior of the system can be described by a stationary linear dynamical system, and that, in the frequency range of interest, the input forces can be modeled as a nonstationary white noise. Consequently the relevant model is the matrix differential system:
04
In this section, we introduce the models for modal analysis, and we describe the stochastic subspace-based identification algorithms, together with one extension to multiple sensor setups.
21
2 Output-Only Subspace-Based Identification Algorithms
02
1.3 Paper Outline. In Section 2, we introduce the models, and the output-only covariance-driven subspace-based identification algorithms we investigate. An extension to the handling of non-simultaneously measured data from multiple sensor setups is also briefly described. Section 3 is devoted to the robustness of these algorithms w.r.t. nonstationary excitation. In Section 4, we describe some implementation issues and some industrial constraints for the assessment of practical applicability of the methods. Then, we report numerical results obtained on three real examples: Ariane V launcher, an helicopter, and a bridge. Section 5 contains further comments and some conclusions.
def
5l, c m 5 w l 5 HF l . Eigenvectors are real if proportional damping is assumed, that is C5 a M 1 b K. Because of the structure of the state in Eq. ~4!, the l’s and w l ’s are pairwise complex conjugate. We assume that the system has no multiple eigenvalues. In addition, 0 is not an eigenvalue of state transition matrix F. The collection of pairs (l, w l ) form a canonical parameterization2 of the pole part of the system in Eq. ~3!, referred to as the system eigenstructure.
S
D
def
T (l, w l )’s based on the following steps. Let R i 5 EY k Y k2i and
def
Hp11,q 5
R0
R1
]
R q21
R1
R2
]
Rq
]
]
]
]
Rp
R p11
]
R p1q21
def
5 Hank~ R i !
(5)
be the output covariance and Hankel matrices, respectively. Assuming a stationary state noise, and introducing the cross2
A parameterization invariant w.r.t. changes in the state basis.
Transactions of the ASME
PROOF COPY 022104JDS
covariance between the state and the observed outputs: G def
5 EX k Y Tk , direct computations of the R i ’s from the model equations lead to R i 5HF i G
(6)
and to the well known @13# factorization Hp11,q 5Op11 ~ H,F ! Cq ~ F,G ! where def
Op ~ H,F ! 5
(3)
(7)
S D H HF ] HF p21
collected successively. Each record j contains data Y (k0,j ) from a fixed reference sensor pool, and data Y (kj ) from a moving sensor pool. The number of sensors may be different in the fixed and the moving pools, and thus in each record j, the measurement vectors Y (k0,j ) and Y (kj ) may have different dimensions. This is what we call multiple sensor setup. To each record j (1< j0. In the stationary case, the excitation covariance matrix does not ( j)T depend on record j: EV (kj ) V k 8 5Q d (k2k 8 ), and the crosscovariance between the state and the fixed sensors output: G
0
0
D0
D
(12)
R ip 5
which factorizes as
SD R i0 R i1 ] R iJ
R ip 5HF i G
def
(13)
(14)
where: H T 5 (H T0 H T1 ¯H TJ ). The corresponding Hankel matrix def
S
Journal of Dynamic Systems, Measurement, and Control
def
JD
2.3 Extension to Multiple Sensor Setups. Instead of a single record for the output (Y k ) of the system in Eq. ~3!, we now have J records
R ij 5H j F i G
Consequently, for each lag i>0, we can stack the R ij ’s into a block-column vector
VT
T Cˆ 5D 1/2 1 V
def
R i0,j 5H 0 F i G5 R i0 ,
04
D1
5 EX (kj ) Y (k0,j ) T does not depend on j either. Therefore, all the covariances in Eq. ~11! factorize, with a constant right factor, as
21
S
ˆ , estimates (H ˆ ,Fˆ ) and (lˆ ,F ˆ l ) are recovered as sketched From O above. The CVA algorithm basically applies the same procedure to a Hankel matrix pre- and post-multiplied by the covariance matrix of future and past data, respectively @16,17#. Connections with stochastic realization are discussed in @14,18,11# and references therein. How to write these algorithms with parameter estimating functions is addressed in @17#. The key feature in this algorithm is the factorization in Eq. ~6!, resulting in the factorization in Eq. ~7!, where the left factor O only depends on the pair ~H, F!, and thus on the eigenstructure of the system in Eq. ~3!, whereas the excitation V k only affects the right factor C through the cross-covariance matrix G. This feature is now elaborated on, for handling multiple sensor setups and nonstationary excitation.
PROOF COPY 022104JDS
~ sensor pool n j !
02
substituted for R i in Hp11,q , yielding the empirical Hankel matrix def ˆ p11,q 5 Hank(Rˆ i ). How to select the number of lags (p1q) and H ˆ p11,q is discussed in Section 4.1. The SVD of thus the size of H ˆ p11,q and its truncation at the desired model order yield, in the H ˆ for the observability matrix O: left factor, an estimate O
ˆ 5UD 1/2 O 1 ,
~ reference pool!
Y ~kj ! 5H j X ~kj !
def
N
1 Rˆ i 5 Y YT N k51 k k2i
ˆ 5UDV T 5U H
Y ~k0,j ! 5H 0 X ~kj !
PY
CO
Of course, for recovering F, we need to assume that rank (Op ) 5dimF, and thus that the number of block-rows in Hp11,q is large enough. The eigenstructure (l,F l ) results from: det(F 2lI)50, FF l 5lF l . The actual implementation of this subspace algorithm, known under the name of balanced realization ~BR! @14,15# has the empirical covariances
j! j! X ~k11 5FX ~kj ! 1V ~k11
Hp 5 Hank(R ip ) factorizes as Hp 5O(H,F)C(F,G), and the algorithm of Section 2.2 applies to Hp . Unfortunately, this merge fails under nonstationary excitation. If the input excitation covariance matrix depends on the record ( j)T index j: EV (kj ) V k 8 5Q j d (k2k 8 ), the cross-covariance matrix: def
G j 5 E j X (kj ) Y (k0,j ) T also depends on j. The factorizations in Eq. ~12! now write with a record-dependent G R i0,j 5H 0 F i G j ,
R ij 5H j F i G j ,
(15)
and vector R ip of stacked covariances defined in Eq. ~13! no longer factorizes as in Eq. ~14!. To circumvent this difficulty, the idea @19# is to normalize the covariance matrices in Eqs. ~11!, ~15! to make them looking as if DECEMBER 2001, Vol. 123 Õ 3
PROOF COPY 022104JDS
they were obtained with the same excitation. One interesting computational feature of the resulting algorithm is that it mainly amounts to apply the classical subspace identification algorithm of Section 2.2 to a Hankel matrix obtained by interleaving the blockcolumns of the reference Hankel matrices and the block-rows of the suitably normalized moving Hankel matrices. It appears from the experimental results in Section 4.5 that this normalization actually tends to smooth out the nonstationarities in the data.
3
Robustness w.r.t. Nonstationary Excitation
F
OO
PR
In Sections 2.2 and 2.3, we have assumed a stationary excitation within the ~each! record, with possibly record-dependent covariance matrix. This is a reasonable approximation when the environmental conditions are slowly time-varying. But a more realistic assumption is that the excitation covariance matrix: EV (kj ) V (kj ) T 5Q k d (k2k 8 ) is time-varying within each record. In that case, the question arises of the relevance of the algorithms introduced in Sections 2.2 and 2.3. Precise mathematical results have been presented in @15,19# which justify the use of the same algorithms, without the need for any change, under the more realistic condition of a nonstationary excitation. We refer the reader to the above reference for precise statements and proofs of results, and we only give here a sketch of this justification. When the excitation is nonstationary, so is the recorded signal Y k . In particular, the empirical covariance matrices Rˆ i in Eq. ~8! no longer converge to some well defined underlying R i when the sample size N goes to infinity. Instead, the matrices Rˆ i may vary in some arbitrary way. Still, we will use them as such. Now the important fact is that, even though Rˆ i does not converge to any sensible value, the following approximate factorization still holds, for N large:
CO
(16)
S
JD
PROOF COPY 022104JDS
04
4 Õ Vol. 123, DECEMBER 2001
21
Experimental Results
We first outline some implementation issues related to the algorithms of Section 2.2. Second, we discuss a number of constraints and requirements of the industrial testing practice, which should be kept in mind for the assessment of the practical applicability of the proposed methods. Then, we present numerical results obtained with the algorithms of Sections 2.2 and 2.3, on three real examples: Ariane V launcher, an helicopter, and a bridge. Other industrial applications can be found in @20–22#. Before proceeding, we stress that the algorithms of Section 2.2 have been implemented within two toolboxes. The first one is the IN-OP module of the LMS software CADA-X, the second one is the modal analysis module of the free INRIA software Scilab @23#. The algorithms for multiple sensor setups of Section 2.3 will be soon available within the Scilab modal analysis module.
An excitation noise at a single constant frequency is recognized as a pole by the algorithm of Section 2.2, designed under the assumption of a white excitation noise. Such a pole can be eliminated provided that an a priori information is available. This is the case of the harmonics of the rotation speed for rotating machines with load unbalancing @12#. Similarly, a colored excitation noise can easily be eliminated provided that its poles are ~significantly! more damped than those of the structure. It is also a common finding that the poles of the structure tend to stabilize when the Hankel matrix order is increased, whereas those of the excitation mostly do not. A nonstationary excitation is actually a favorable situation, since the averaging performed in Eq. ~8! for computing G tend to whiten the noise. This is the case of a chirp-like nonstationary excitation. If a measurement noise is enforced in Eq. ~3!, then the Hankel matrix in Eq. ~5! should be filled with delayed covariances @17#.
02
N ˆ 51/NS k51 where: G X k Y Tk and o(N) goes to zero when the sample size N goes to infinity. Assumptions for this to hold are somewhat technical, but they roughly formulate as follows: the covariance matrix of the excitation has to be uniformly bounded, and the n-th singular value of ˆ built using the R i ’s is uniformly the empirical Hankel matrix H bounded from below, where n is the assumed model order. This latter assumption formalizes the requirement that all the modes of the structure should be excited. Clearly, the approximate factorization in Eq. ~16! is the key step in proving the consistency of the method. A full proof of this is provided in the above mentioned references @15,19#, where it is shown that the eigenstructure estimate (lˆ , wˆ l ) is a consistent estimate of the true eigenstructure. Although this mathematical justification was possible only under the assumption of known model order, the experimental use of the method has shown that it extends to the practical situation of unknown model order as well.
4
• It is of no practical help to select for Hp11,q in Eq. ~5! other values than q5p11 ~unless p is small!. The number of lags 2p for the data covariances should be large ~typically more than two hundreds in the experiments below!. • The number of modes should be overestimated, because modes tend to stabilize, and even to show up, for high orders. In other words, the SVD in the algorithm of section 2.2 should be truncated at an order much greater than the ‘‘theoretical’’ order, that is 2m/r21, where m is the number of desired modes and r is the number of sensors.
PY
ˆ 1o ~ N ! Rˆ i 5HF i G
4.1 Practical Implementation Issues. The selection of the model order, and thus of the size of the Hankel matrices on one hand, and the handling of the presence and nature of excitation and measurement noises on the other hand, are two major practical issues which we address now. As stressed in @12,22,11#, when few sensors are available, a number of modes which is much smaller than the number of solutions of Eq. ~2!, but much larger than the number of sensors, can be identified. In order to extract the modes from the data, we have to apply the subspace method with an increasing SVD truncation order and to look for the relevant modes in the frequency band of interest. Since the subspace method yields a set of modes with both structural—from the structure and the excitation—and spurious mathematical modes, we have to derive a practical way to distinguish between the two types of modes. Fortunately, spurious modes tend to vary from one model order to the next. That is why usage suggests to plot the frequencies against SVD truncation order, in a stability or stabilization diagram @24,11,25#. We stress that this SVD truncation approach implicitly introduces a filtering at the level of system characteristics, while most other identification methods just try to fulfill forcefully a mathematical model order. This procedure is used in the sequel to display our results. It should be stressed that, in both CADA-X and Scilab toolboxes, the stability of the modes is evaluated on the frequencies, the damping coefficients, and the mode-shape components. Numerous experiments with the classical subspace method have shown that:
4.2 Industrial Testing Requirements. What is important, in view of the practical applicability of the various methods to full-scale problems, is the way they are able to cope with the constraints and requirements of the industrial testing practice. These include: • The use of large numbers of response transducers: this may range from 8 to 16 responses in a flutter test to 128 or more sensors in a car road test. • The subdivision of a test in ‘‘patches’’ or sensor groups, leading to non-simultaneously measured data ~Section 2.3, @19#!. • Sensitivity to data preprocessing: resampling, resynchronization, band-filtering etc. • The nonwhiteness of the ~unknown! excitation ~Section 4.1, @12,19#!. Transactions of the ASME
PROOF COPY 022104JDS
PR
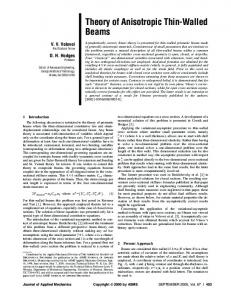
Fig. 2 Ariane V launcher-timeÕfrequency analysis of a signal measured at the bottom of a fuel tank in the EPS stage in the longitudinal direction. Abscissa: time, ordinate: frequency.
OO
were sampled at different sampling frequencies and were characterized by different time offsets from the common time t o . Therefore, the data have been first converted into a consistent response database, through a preprocessing made of the following steps:
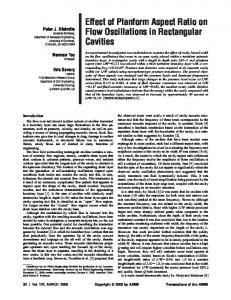
Fig. 1 Ariane V launcher-the main components
F
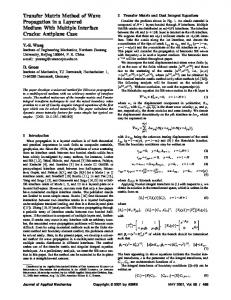
We now report on the identification of the suspension modes of the fuel tanks in the EPS stage, using the BR method applied to eight reprocessed signals measured at the bottom of the four tanks in different directions. The sampling rate of the pre-processed signals is 93.4 Hz. A time/frequency plot of one of the signals is depicted in Fig. 2, which shows the nonstationary behavior of the excitation. The strongest responses occur around 7.3 seconds, when the launcher lifts off. A detailed inspection of the autopower spectra revealed a small shift in peaks as a function of time, suggesting a small effect of the mass decrease, due to fuel consumption, on the modal parameters. In order to better understand this, the output-only modal analyses have been performed on the time data segments given in Table 1. Note that segment S4 combines segments S1, S2, and S3, and that segments S1 and S4 include the time responses around 7 seconds when the boosters are ignited and the main excitation occurs. The BR method is run here with a number of block rows equal to 64 and a number of block columns about twice as large. A stabilization diagram for data segment S1 is plotted in Fig. 3, which clearly allows to select the stable poles. Note that this stabilization diagram contains information on the convergence of the damping values and of the modal vector values based on a difference calculation. This explains the symbols f ~frequency stabilization only!, d ~damping stabilization as well!, v ~vector stabilization! and s ~overall stabilization!. Figure 4 shows the relative change in natural frequencies of the modes over the four data segments. Since the excitation in segment S1 is the best, the results obtained in this segment are taken as reference. Figure 4 reveals a small frequency increase from S1 to S3, probably due to the mass decrease. The natural frequency for segment S4 is very similar to S1. It is interesting to note that
PY
CO
• The nonstochastic nature of the excitation: sweeps, or impulses, through aircraft control surfaces etc. • The superposition of large levels of harmonic components: e.g. helicopter rotor frequencies, car engine harmonics, turbine shaft or gear speeds, . . . ~Section 4.1, @12,19#!. • Large data sample sizes, often contaminated with large measurement errors. • Large model sizes. • Robustness to model inconsistencies: small variations in system behavior during the test or in-between subsequent ‘‘patches’’ . . . @19#. • Robustness to nonstationary excitation ~section 3, @15,19#!. • The ease of order selection, including the generation of nonphysical poles. • The computational efficiency, especially in view of large data sample sizes, large sensor count, and large model orders ~section 4.4!. • The efficiency in estimating damping ratios @26#. • The capability to generate confidence intervals @27–29#.
• Conversion of the nonequidistant nonsimultaneous data into an equidistant, uniform, time axis on the basis of a cubic spline interpolation; • Resampling of the equidistant data to a common sampling rate; • Zero-mean and drop-out adjustment of the signals.
S
JD
PROOF COPY 022104JDS
04
Journal of Dynamic Systems, Measurement, and Control
21
4.3 In-Flight Data From Ariane V Launcher. The goal here is to identify the modes of the main components of the European Ariane V launcher during the initial launch phase, using time response data recorded on the launcher during flight 501. This flight only lasted 39 seconds due a failure of the inertial reference system. About one hundred accelerometers were mounted on different components of the launcher shown in Fig. 1: the booster segments, the booster skirts JAR and JAV, the booster attachments DAAR and DAAV, the LH2 and LOX tanks in the main cryogenic stage, the VULCAIN and AESTUS engines and the MMH and N204 tanks in the EPS stage. The data were recorded via a telemetry measurement system. As different data recording systems were used, the available time response data had quite different characteristics. Although all data channels were synchronized w.r.t. a common instant t o , the data of each channel were slightly nonequidistant, due to rounding-off errors (10m s) and to the data sampling and telemetry system ~e.g., transmission losses due to antenna masking!. In addition, the data channels
02
The answers to these questions are essential in the assessment of the practical applicability of the proposed methods. We now turn to the three real application examples.
Table 1 Ariane V launcher-Data segments used for the identification
DECEMBER 2001, Vol. 123 Õ 5
PROOF COPY 022104JDS
OO
PR F
Fig. 3 Ariane V launcher-stabilization diagram for the suspension modes of the fuel tanks in the EPS stage „data segment S1…. Abscissa: frequencies, ordinate: increasing SVD truncation order. The symbols contain information on the convergence of damping ratios and of modal vector values. Results from the LMS CADA-X IN-OP module.
CO
The identification has been performed with the BR method, on each setup separately, without removing the harmonic excitation of the rotors. A typical stabilization diagram is shown in Fig. 5. This stabilization diagram contains the same information on the damping and modal vector values as Fig. 3 discussed in Section 4.3. The stabilization of the frequency and damping of a typical pole ~6.412 Hz! as a function of the order and this for various numbers of block rows is shown in Fig. 6. This figure clearly shows the improvement in the damping estimate behavior when increasing ~up to 64! the number of block rows. The smoothness of the damping estimate is a quality criterion. The jump around order 36 is likely to be due to the fact that from that frequency onwards, an additional pole appeared ~or one disappeared! in the pole table. The identified poles are summarized in Table 2. The poles related to harmonic components of the rotors are clearly identified by their low damping ratio, and the a priori knowledge of the frequencies. They are indicated as MR ~Main Rotor! and TR ~Tail Rotor!. An example of a modeshape ~tail boom flapping! is shown in Fig. 7. The estimated modes were correlated with those of ground tests and a FEM model.
PY
the damping ratio identified for S4 was about 20% higher than for S1, which can be explained by the small natural frequency shift over the segments S1 to S3.
Fig. 5 Helicopter-a typical stabilization diagram „sampling frequency 100 Hz and p Ä64…. Abscissa: frequencies, ordinate: increasing SVD truncation order. The symbols contain information on the convergence of damping ratios and of modal vector values. Results from the LMS CADA-X IN-OP module.
S
JD
04
First the data have been down-sampled to 100 Hz. This is favorable to the computing time, since this reduces the correlation computation time, the number of required block rows and columns, and hence the SVD computation time.
21
• Sampling using available flight-test equipment at 800 Hz; • Nonsimultaneous measurement of the data: 3 patches of 36 sensors with 6 reference sensors; • Strong harmonic components in the frequency range of interest ~0–30 Hz!, due to the main and the tail rotors.
02
4.4 In-Flight Data From a Helicopter. The objective of the modal analysis performed on the helicopter is to validate—and update—ground test models, and also to provide input to the refinement of a helicopter FEM model for in-flight conditions @30,31#. The specific features here are:
4.5 Polyreference Data From a Bridge. We now show two typical results obtained with data from the Swiss Z24 bridge, a benchmark of the BRITE/EURAM project SIMCES on identification and monitoring of civil engineering structures, for which EMPA3 has carried out tests and recorded the response of the bridge to traffic excitation under the bridge. The main features of those data are @32#: • Sampling at 100 Hz; sample size 65535; Nonsimultaneous measurement of the data: 9 patches of 19 sensors with 4 reference sensors; Data recorded under quite different temperature and traffic conditions ~nonstationary excitation!. Fig. 4 Ariane V launcher-relative change in the natural frequency of a mode for data segments S1, S2, S3 and S4
6 Õ Vol. 123, DECEMBER 2001 PROOF COPY 022104JDS
3
EMPA is the Swiss Federal Laboratories for Materials Testing and Research.
Transactions of the ASME
PROOF COPY 022104JDS
Fig. 7 Helicopter-Modeshape at 16.41 Hz
OO
PR
Fig. 6 Helicopter-natural frequency „upper… and damping ratio „lower… of mode at 6.4 Hz as a function of the SVD truncation order, for three different numbers of block-rows. Abscissa: frequency „upper… and damping ratio „lower…, ordinate: increasing SVD truncation order.
Table 2 Helicopter-Identified poles
F 5.1 Correlating In-Operation and Laboratory Models. It is obvious from the above examples that the in-operation modal models provide relevant additional information to the results from operating shape analysis, on the one hand, and laboratory modal analysis, on the other. From the correlation between in-operation and laboratory models, changes in resonance frequency, damping ratios and even modeshapes can be obtained. In particular, the availability of damping values is a major improvement to standard ODS analysis. From the decomposition at critical frequencies of operating deflection shapes into the in-operation modes, the relative importance of these modes to a particular problem can be assessed. By correlating the results to FEM models, the parameters of such models can be validated and updated to better reflect the actual structure. An important application is the updating of the constraining conditions of FEM models of specific components ~bushings, connections, . . . ! in assembly.
PY
CO
Fig. 8 Meaning of the symbols in Figs. 9 and 10
4 Note that these covariance matrices are column vectors, since only one reference sensor is available in each of the two records.
Journal of Dynamic Systems, Measurement, and Control PROOF COPY 022104JDS
5.2 Using In-Operation Models for Damage Detection. Another important application of in-operation models consists in detecting and diagnosing changes in structures, for endurance test monitoring, for integrity verification and damage assessment, or for predictive maintenance. The first question in this context is the detection of a structural change or damage. A straightforward strategy to tackle that problem would be the comparison of the reference modal model with a modal model identified from fresh data. However, in case of small deviations, it is very difficult to decide whether the difference is statistically significant, and whether it is due to damage, or to measurement and modeling precision, or to changing excitation. Another important drawback of such a modal model comparison approach is that the modal parameters need to be extracted from each recorded data set, which is not appropriate for health monitoring systems, since modal analysis requires user interaction. For these two reasons, an alternative approach has been elaborated, which allows to decide whether a modal model of the
S
In this section, we discuss further two important uses of inoperation models.
JD
Further Comments and Conclusions
04
5
21
02 From those data, we have selected J52 records from sensors in the vertical direction, with one reference sensor, and two moving sensors in the first record, and only one moving sensor in the second record. Figure 9 shows the results obtained on the second record ~two sensors! with the classical subspace identification algorithm of Section 2.2, based on full data covariances and on q5128, in a stabilization diagram which symbols are explained in Fig. 8. The results obtained, on the data from the two records, with the subspace identification algorithm for multiple sensor setups of Section 2.3, based on partial covariances4 in Eq. ~11! and on q 5128, are shown in Fig. 10. This figure shows up several improvements over Fig. 9 on several aspects: spurious modes disappear; true modes appear and stabilize faster and fluctuate less in the diagrams; the damping of the true modes is more accurately estimated ~Fig. 10!. More detailed comments and results on this example can be found in @19#.
DECEMBER 2001, Vol. 123 Õ 7
PROOF COPY 022104JDS
PR
Fig. 9 Z24 Bridge-classical subspace identification: second record „2 sensors…. Abscissa: increasing SVD truncation order, ordinate: frequencies. The symbols, explained in Fig. 8, stand for different damping ratios. Results from the INRIA Scilab modal analysis module.
F
OO PY
CO 02
8 Õ Vol. 123, DECEMBER 2001 PROOF COPY 022104JDS
S
5.3 Concluding Remarks. We have discussed in-operation structural analysis, and have advocated the use of output-only and
covariance-driven subspace-based stochastic identification methods, of which we have investigated theoretical and experimental properties. Particular attention has been paid to the crucial issues of robustness with respect to nonstationary excitation, and handling non-simultaneously measured data from multiple sensor setups. The algorithms described in Section 2.2 have been implemented within two toolboxes: the IN-OP module of the LMS software CADA-X, and the modal analysis module of the free INRIA software Scilab @23#. The algorithms for multiple sensor setups of Section 2.3 will be soon available within the Scilab module.
JD
healthy structure describes well the dynamics of the newly recorded response data. Small deviations in the modal parameters are evaluated with the aid of one global value, which is statistically interpreted, indicating whether the structure is healthy or not. In case of damage, the technique allows to suggest the modes that are most affected. This approach has been used for several applications @22,33,26#. How subspace-based identification principles can be used for the design of a subspace-based damage detection algorithm is described in detail in @17#. This design procedure is a particular instance of a much more general change detection design framework, described in @34,35#. The second question in change detection is the isolation of the geometric location and the diagnosis of the structural component responsible for the change. One solution consists in plugging, within the above subspace detection approach, the sensitivities of the FE-model parameters w.r.t. the modeshapes, after some clustering for generating macro-failures. This allows to generate tests focused in specific directions of the physical parameters space, and to perform on-board part of the isolation and diagnostics tasks. This is explained in @22,36#.
04
21
Fig. 10 Z24 Bridge-polyreference subspace identification with the two records. Abscissa: increasing SVD truncation order, ordinate: frequencies. The symbols, explained in Fig. 8, stand for different damping ratios. Results from the INRIA Scilab modal analysis module.
References @1# Zimmerman, H., and Destuynder, R., 1982, ‘‘Flight Flutter Testing with Emphasis on the Tip Vane Method,’’ Proceedings, AGARD Conf. 339 on Ground Flight Testing & Correlation. @2# Schippers, P., and Persoon, A. J., 1995, ‘‘Flight Flutter Testing of a Turbo Prop Aircraft by using External Excitation Devices,’’ Proceedings, AGARD Conf. 566 on Advanced Aeroservoelastic Testing and Data Analysis, Rotterdam ~NL!, pp. 3.1–3.11. @3# De Vis, D., Gielen, L., Verhoeven, J.,;Nordmann, R., and Neumer, T., 1992, ‘‘Indirect identification of fluid structure interaction forces in boilerfeed pumps,’’ Proceedings, 10th International Modal Analysis Conference, San Diego ~CA!, pp. 47–53.
Transactions of the ASME
PROOF COPY 022104JDS
F
OO
PR
@4# Ewins, D. J., 1984, Modal Testing: Theory and Practice, Research Studies Press, Letchworth, Hertfordshire, UK. @5# Juang, J. N., 1994, Applied System Identification, Prentice Hall, Englewood Cliffs, NJ. @6# De Roeck, G., Peeters, B., and Ren, W.-X., 2000, ‘‘Benchmark study on system identification through ambient vibration measurements,’’ Proceedings, 18th International Modal Analysis Conference, San Antonio, TX, pp. 1106 – 1112. @7# Viberg, M., 1995, ‘‘Subspace-based methods for the identification of linear time-invariant systems,’’ Automatica, 31, No. 12, pp. 1835–1853. @8# Van Overschee, P., and De Moor, B., 1996, Subspace Identification for Linear Systems: Theory-Implementation-Applications, Kluwer Academic Publishers. @9# Van Overschee, P., and De Moor, B., 1994, ‘‘N4SID: Subspace algorithms for the identification of combined deterministic-stochastic systems,’’ Automatica, 30, No. 2, pp. 75–93. @10# Viberg, M., Wahlberg, B., and Ottersten, B., 1997, ‘‘Analysis of state space system identification methods based on instrumental variables and subspace fitting,’’ Automatica, 33, No. 9, pp. 1603–1616. @11# Peeters, B., and De Roeck, G., 1999, ‘‘Reference-based stochastic subspace identification for output-only modal analysis,’’ Mech. Syst. Signal Process., 13, No. 6, pp. 855– 878. @12# Prevosto, M., Olagnon, M., Benveniste, A., Basseville, M., and LeVey, G., 1991, ‘‘State-space formulation, a solution to modal parameter estimation,’’ J. Sound Vib., 148, pp. 329–342. @13# Stoı¨ca, P., and Moses, R. L., 1997, Introduction to Spectral Analysis, Prentice Hall. @14# Akaı¨ke, H., 1974, ‘‘Stochastic theory of minimal realization,’’ IEEE Trans. Autom. Control, AC-19, pp. 667– 674. @15# Benveniste, A., and Fuchs, J.-J., 1985, ‘‘Single sample modal identification of a nonstationary stochastic process,’’ IEEE Trans. Autom. Control, AC-30, pp. 66 –74. @16# Akaı¨ke, H., 1973, ‘‘Markovian representation of stochastic processes by canonical variables,’’ SIAM J. Control, 13, pp. 162–173. @17# Basseville, M., Abdelghani, M., and Benveniste, A., 2000, ‘‘Subspace-based fault detection algorithms for vibration monitoring,’’ Automatica, 36, pp. 101– 109. @18# Arun, K. S., and Kung, S. Y., 1986, ‘‘Generalized principal components analysis and its application in approximate stochastic realization,’’ Modeling and Application of Stochastic Processes, U. B. Desai, ed., Kluwer Academic Publishers, pp. 75–103. @19# Mevel, L., Benveniste, A., Basseville, M., and Goursat, M., 2000, ‘‘Blind subspace-based eigenstructure identification under nonstationary excitation using moving sensors,’’ IRISA Research Report no 1354, http://www.irisa.fr/ bibli/publi/pi/2000/1354/1354.html. @20# Abdelghani, M., Goursat, M., Biolchini, T., Hermans, L., and Van der Auweraer, H., 1999, ‘‘Performance of output-only identification algorithms for modal analysis of aircraft structures,’’ Proceedings, 17th International Modal Analysis Conference, Kissimmee, FL, pp. 224 –230.
PY
CO
@21# Hermans, L., and Van der Auweraer, H., 1999, ‘‘Modal testing and analysis of structures under operational conditions: industrial applications,’’ Mech. Syst. Signal Process., 13, No. 2, pp. 193–216. @22# Basseville, M., Benveniste, A., Gach-Devauchelle, B., Goursat, M., Bonnecase, D., Dorey, P., Prevosto, M., and Olagnon, M., 1993, ‘‘Damage monitoring in vibration mechanics: issues in diagnostics and predictive maintenance,’’ Mech. Syst. Signal Process., 7, No. 5, pp. 401– 423. @23# Goursat, M., Basseville, M., Benveniste, A., and Mevel, L., 2000, ‘‘A Scilab toolbox for output only modal analysis and diagnosis,’’ Proceedings, 18th International Modal Analysis Conference, San Antonio ~TX!. ftp://ftp.inria.fr/ INRIA/Projects/Meta2/Scilab/contrib/MODAL/. @24# Allemang, R. J., and Brown, D. L., 1998, ‘‘A unified matrix polynomial approach to modal identification,’’ J. Sound Vib., 211, pp. 301–322. @25# Van der Auweraer, H., Leurs, W., Mas, P., and Hermans, L., 2000, ‘‘Modal parameter estimation from inconsistent data sets,’’ Proceedings, 18th International Modal Analysis Conference, San Antonio, TX, pp. 763–771. @26# Abdelghani, M., Goursat, M., and Biolchini, T., 1999, ‘‘On-line monitoring of aircraft structures under unknown excitation,’’ Mech. Syst. Signal Process., 13, No. 6, pp. 839– 853. @27# Ottersten, B., Viberg, M., and Kailath, T., 1992, ‘‘Analysis of subspace fitting and ML techniques for parameter estimation,’’ IEEE Trans. Signal Process., 40, pp. 590–599. @28# Bauer, D., Deistler, M., and Scherrer, W., 1999, ‘‘Consistency and asymptotic normality of some subspace algorithms for systems without observed inputs,’’ Automatica, 35, pp. 1243–1254. @29# Benveniste, A., Basseville, M., and Mevel, L., 2000, ‘‘Convergence rates for eigenstructure identification using subspace methods,’’ Proceedings, 39th IEEE Conference on Decision and Control, Sydney, Australia. @30# Uhl, T., Bochniak, W., Lisowski, W., Hermans, L., Van der Auweraer, H., and Malecki, J., 1999, ‘‘FE-model correlation of a helicopter using ground test results,’’ Proceedings, 17th International Modal Analysis Conference, Kissimmee, FL, pp. 940–946. @31# Lisowski, W., Uhl, T., Malecki, J., Hermans, L., and Van der Auweraer, H., 2000, ‘‘Investigation of structural dynamics properties of helicopter airframe,’’ Proceedings, ISMA 25, Leuven ~B!, pp. 627– 634. @32# Peeters, B., and De Roeck, G., 2000, ‘‘One year monitoring of the Z24-bridge: environmental effects versus damage events,’’ Proceedings, 18th International Modal Analysis Conference, San Antonio, TX, pp. 1570–1576. @33# Mevel, L., Hermans, L., and Van der Auweraer, H., 1999, ‘‘Application of a subspace-based fault detection method to industrial structures,’’ Mech. Syst. Signal Process., 13, No. 6, pp. 823– 838. @34# Basseville, M., 1998, ‘‘On-board component fault detection and isolation using the statistical local approach,’’ Automatica, 34, No. 11, pp. 1391–1416. @35# Basseville, M., and Nikiforov, I. V., 1993, Detection of Abrupt ChangesTheory and Applications, Prentice Hall, Englewood Cliffs, N.J. http:// www.irisa.fr/sigma2/kniga. @36# Gach-Devauchelle, B., 1991, ‘‘Diagnostic Me´canique des Fatigues sur les Structures Soumises a` des Vibrations en Ambiance de Travail,’’ Thesis, Paris IX Dauphine University ~in French!.
S
JD
04
21
02 Journal of Dynamic Systems, Measurement, and Control PROOF COPY 022104JDS
DECEMBER 2001, Vol. 123 Õ 9