Introduction. The most commonly used mathematical formulation for a beam with a constrained layer damping treatment was developed by. Mead and Markus 1.
Journal of Vibration and Acoustics
Technical Briefs
Experimental Measurement of Mode Shapes and Frequencies for Vibration of Plates by Optical Interferometry Method Chi-Hung Huang Associate Professor, Department of Mechanical Engineering, Ching Yun Institute of Technology, ChungLi, Taiwan 320, Republic of China
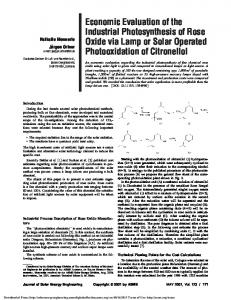
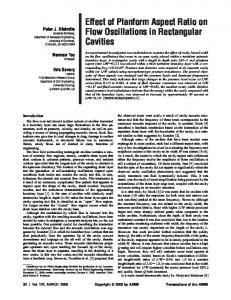
Chien-Ching Ma Professor, Department of Mechanical Engineering, National Taiwan University, Taipei, Taiwan 106, Republic of China Fig. 1 Schematic layout of the experimental ESPI setup for out-of-plane displacement measurement
Most of the published literature for vibration mode shapes of plates is concerned with analytical and numerical results. There are only very few experimental results available for the full field configuration of mode shapes for vibrating plates. In this study, an optical system called the AF-ESPI method with the outof-plane displacement measurement is employed to investigate experimentally the vibration behavior of square isotropic plates with different boundary conditions. The edges of the plates may either be clamped or free. As compared with the film recording and optical reconstruction procedures used for holographic interferometry, the interferometric fringes of AF-ESPI are produced instantly by a video recording system. Based on the fact that clear fringe patterns will appear only at resonant frequencies, both resonant frequencies and corresponding mode shapes can be obtained experimentally at the same time by the proposed AFESPI method. Excellent quality of the interferometric fringe patterns for the mode shapes is demonstrated. 关DOI: 10.1115/1.1352018兴
1
Introduction
Holographic interferometry opened new worlds of research by making possible accurate, global measurement of small dynamic surface displacements in a two-step process for a wide variety of objects. For this purpose, different methods of holographic interferometry have been developed for vibration analysis, which have made possible the gathering of a large amount of practical and theoretical information. Unfortunately, the slow and cumbersome process of film development limits the application of holographic vibration analysis in industry. Electronic speckle pattern interferContributed by the Technical Committee on Vibration and Sound for publication in the JOURNAL OF VIBRATION AND ACOUSTICS. Manuscript received Nov. 1999; revised Oct. 2000. Associate Editor: J. Q. Sun.
276 Õ Vol. 123, APRIL 2001
Fig. 2 Geometric dimension and configuration of isotropic square plates
Copyright © 2001 by ASME
Transactions of the ASME
Downloaded 31 Oct 2008 to 140.112.113.225. Redistribution subject to ASME license or copyright; see http://www.asme.org/terms/Terms_Use.cfm
Table 1 Comparison of theoretical predicted resonant frequencies with experimental results for the FCFF plate
Table 2 Comparison of theoretical predicted resonant frequencies with experimental results for the CCFF plate
ometry 共ESPI兲, which was first proposed by Butters and Leendertz 关1兴 to investigate the out-of-plane vibration behavior, is a fullfield, noncontact, and real-time measurement technique of deformation for structures subjected to various kinds of loadings. As compared with the traditional holographic interferometry 共Rastogi
关2兴兲, the interferometric fringe patterns of ESPI are recorded by video camera, which speeds up the process by eliminating timeconsuming chemical development. Since the interferometric image is recorded and updated by the video camera every 1/30 second, ESPI is faster in operation and more insensitive to
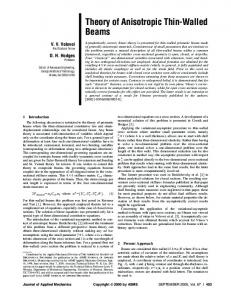
Fig. 3 The first 17 mode shapes obtained by using the experimental AF-ESPI system and the finite element analysis for the FCFF plate
Journal of Vibration and Acoustics
APRIL 2001, Vol. 123 Õ 277
Downloaded 31 Oct 2008 to 140.112.113.225. Redistribution subject to ASME license or copyright; see http://www.asme.org/terms/Terms_Use.cfm
Fig. 3
„Continued…
environment than holography. Because of the reasons mentioned above, ESPI has become a powerful technique in many academic research and engineering applications. In order to increase the visibility of the fringe pattern and reduce the environmental noise simultaneously, an amplitude-fluctuation ESPI 共AF-ESPI兲 method was proposed by Wang et al. 关3兴 for out-of-plane vibration measurement. In the amplitude-fluctuation ESPI method, the reference frame is recorded in a vibrating state and subtracted from the incoming frame. Ma and Huang 关4,5兴 used the AF-ESPI method to investigate the three-dimensional vibrations of piezoelectric rectangular parallelepipeds and cylinders; both the resonant frequencies and mode shapes were presented and discussed in detail. The study of the vibration behavior of a plate is a problem of great practical interest. However, very few experimental results, especially for the full field measurement of mode shapes, are available in the literature. In this paper, the optical method based on the amplitude-fluctuation ESPI 共AF-ESPI兲 is employed to study experimentally the resonant characteristics of free vibration for isotropic square plates with different boundary conditions. The optical arrangement of the AF-ESPI method for the out-of-plane vibrating measurement is show schematically in Fig. 1. The ad278 Õ Vol. 123, APRIL 2001
vantage of using the AF-ESPI method is that both resonant frequencies and the corresponding mode shapes can be obtained simultaneously from the experimental investigation. The fringe patterns shown in the experimental results are correspondent to the vibrating mode shapes. Two cases are studied which involve the possible combinations of free and clamped edge conditions; they are Free-Clamped-Free-Free 共FCFF兲 and Clamped-ClampedFree-Free 共CCFF兲. In addition to the AF-ESPI experimental technique, numerical computations based on a finite element package are also presented and good agreements of resonant frequencies and mode shapes are found for both results.
2 Experimental Results and Numerical Analysis for Vibrating Plates Two isotropic aluminum plates 共6061T6兲 are used in this study for experimental investigations and numerical calculations, where the material properties of the plate are mass density ⫽2700 kg/m3, Young’s modulus E⫽70 Gpa and Poisson’s ratio ⫽0.33. By using the combinations of free 共F兲 and clamped 共C兲 edges, the resonant frequencies and mode shapes of FCFF and CCFF plates Transactions of the ASME
Downloaded 31 Oct 2008 to 140.112.113.225. Redistribution subject to ASME license or copyright; see http://www.asme.org/terms/Terms_Use.cfm
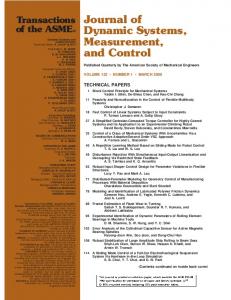
Fig. 4 The first 15 mode shapes obtained by using the experimental AF-ESPI system and the finite element analysis for the CCFF plate
are investigated. The geometric dimensions of two plates with different boundary conditions are shown in Fig. 2. The thickness of two isotropic plates are all 1 mm. The schematic layout of a self-arranged AF-ESPI optical system as shown in Fig. 1 is employed to perform the out-of-plane vibration measurement for the resonant frequency and the corresponding mode shape. As shown in Fig. 1, a 30-mW He-Ne laser with wavelength ⫽632.8 nm is used as the coherent light source. The laser beam is divided into two parts, the reference and object beam, by a beamsplitter. We use a CCD camera 共Pulnix company兲 and a P360F 共Dipix Technologies Inc.兲 frame grabber with DSP on board to record and process the images. The object beam travels to the specimen and then reflects to the CCD camera. The reference beam goes directly to the CCD camera via a mirror and the reference plate. It is important to note that the optical path and the light intensity of these two beams should remain identical in the experimental setup. The CCD camera converts the intensity distribution of the interference pattern of the object into a corresponding video signal at 30 frames per second. The signal is electronically processed and converted into an image on the video Journal of Vibration and Acoustics
monitor. The interpretation of the fringe image is similar to reading a contour map. In order to increase the intensity of light reflection of specimens and the contrast of fringe patterns, the surfaces of plates are coated with white paint which is mixed with fine seaweed powder. The isotropic plate is excited by a piezostack actuator 共PI company兲 which is attached behind the specimen. To achieve the sinusoidal output, a function generator HP33120A 共Hewlett Packard兲 connected to a power amplifier 共NF corporation兲 is used. Numerical results of resonant frequencies and mode shapes are calculated by using the commercially available software, ABAQUS finite element package. The eight noded twodimensional quadrilateral thick shell element 共S8R5兲 and reduced integration scheme are used to analyze the problem. This element approximates the Midlin-type element that accounts for rotary inertia effects and first order shear deformations through the thickness. The results presented in Tables 1–2 show generally good agreement between the numerically predicted and experimentally measured resonant frequencies. Figures 3–4 are the mode shapes for both experimental measurements and numerical APRIL 2001, Vol. 123 Õ 279
Downloaded 31 Oct 2008 to 140.112.113.225. Redistribution subject to ASME license or copyright; see http://www.asme.org/terms/Terms_Use.cfm
tion problems. The advantages of the optical ESPI method include noncontact and full-field measurement, real-time observation, submicron sensitivity, validity of both static deformation and dynamic vibration, and direct digital image output. Because ESPI uses video recording and display, it works in real time to measure dynamic displacement. Its real-time nature makes it possible to implement this technique for vibration measurement. A selfarranged amplitude-fluctuation ESPI optical setup with good visibility and noise reduction has been established in this study to obtain the resonant frequencies and the corresponding mode shapes of free vibrating isotropic square plates at the same time. Two different types of boundary conditions are investigated in this study and more than thirty excellent quality mode shapes are presented by the proposed experimental optical interferometry method. Numerical calculations of resonant frequencies and mode shapes based on a finite element package are also performed and excellent agreements are obtained if compared with experimental measurements.
Acknowledgments The authors gratefully acknowledge the financial support of this research by the National Science Council 共Republic of China兲 under Grant NSC 87-2218-E002-022.
References 关1兴 Butters, J. N., and Leendertz, J. A., 1971, ‘‘Speckle Pattern and Holographic Techniques in Engineering Metrology,’’ Opt. Laser Technol., 3, No. 1, pp. 26–30. 关2兴 Rastogi, P. K., 1994, Holographic Interferometry, Springer-Verlag. 关3兴 Wang, W. C., Hwang, C. H., and Lin, S. Y., 1996, ‘‘Vibration Measurement by the Time-Averaged Electronic Speckle Pattern Interferometry Methods,’’ Appl. Opt., 35, No. 22, pp. 4502–4509. 关4兴 Huang, C. H., and Ma, C. C., 1998, ‘‘Vibration Characteristics for Piezoelectric Cylinders Using Amplitude-Fluctuation Electronic Speckle Pattern Interferometry,’’ AIAA J., 36, No. 12, pp. 2262–2268. 关5兴 Ma, C. C., and Huang, C. H., 2001, ‘‘The Investigation of Three-Dimensional Vibration for Piezoelectric Rectangular Parallelepipeds by Using the AF-ESPI Method,’’ IEEE Trans. Ultrason. Ferroelectr. Freq. Control, 48, No. 1, pp. 142–153.
Fig. 4
„Continued…
simulations. There are 17 modes and 15 modes presented for FCFF and CCFF plates, respectively. For the finite element calculations, the contours of constant displacement for resonant mode shapes are plotted in order to compare with the experimental observation. In Figs. 3–4, we indicate the phase of displacement in finite element results as solid or dashed line, the solid lines are in the opposite direction to the dashed lines. The transition from solid lines to dashed lines corresponds to a zero displacement line, or nodal line. The zero-order fringe, which is the brightest on the experimental image, represents the nodal lines of the vibrating square plate at resonant frequencies. The rest of the fringes are contours of constant amplitudes of displacement. Excellent quality of the experimental fringe patterns for vibration mode shapes are presented in Figs. 3–4. The mode shapes obtained by experimental results can be checked by the nodal lines and fringe patterns with the numerical finite element calculations in excellent agreement.
3
A Comment on Boundary Conditions in the Modeling of Beams with Constrained Layer Damping Treatments Peter Y. H. Huang, Per G. Reinhall, and I. Y. Shen Mechanical Engineering Department, University of Washington, Seattle, Washington 98195-2600 关DOI: 10.1115/1.1349887兴
Introduction The most commonly used mathematical formulation for a beam with a constrained layer damping treatment was developed by Mead and Markus 关1兴. In their formulation, the base beam and the constraining layer are set to undergo identical transverse deflections and the longitudinal displacements of the base beam and the constraining layer are set to be related via the thickness and
Conclusions
Optical techniques have been shown to have certain advantages for vibration analysis and ESPI has been applied to many vibra280 Õ Vol. 123, APRIL 2001
Contributed by the Technical Committee on Vibration and Sound for publication in the JOURNAL OF VIBRATION AND ACOUSTICS. Manuscript received Jan. 2000; revised Sept. 2000. Associate Editor: J. Q. Sun.
Copyright © 2001 by ASME
Transactions of the ASME
Downloaded 31 Oct 2008 to 140.112.113.225. Redistribution subject to ASME license or copyright; see http://www.asme.org/terms/Terms_Use.cfm
Young’s modulus of each layer. As a result, the Mead-Markus formulation only applies to a class of systems with boundary conditions described in Markus et al. 关2兴, Rao 关3兴, and Lifshitz and Leibowitz 关4兴. Trompette et al. 关5兴 were first to investigate the practical implication of this issue by investigating a specific constrained layer damped cantilevered beam. The purpose of this study was to investigate a broader range of boundary and damping treatment configurations. The error of the Mead-Markus formulation was investigated as a function of the thickness of viscoelastic layer and was shown to be large for certain common boundary conditions. A modified Mead-Markus formulation that allows the longitudinal motion of the base beam and constraining layer to be independent from each other is suggested as a remedy.
Cantilevered Beam Figure 1 shows the displacement variables fields associated with the Mead-Markus model for an Euler-Bernoulli beam. The transverse displacement is represented by w(x,t), and longitudinal displacement of the j-th layer is represented by u j (x,t), where x is the position along the beam and t is time. The subscripts 1, 2 and 3 refer to the base beam, the viscoelastic layer, and the constraining layer, respectively. All the layers have length L and width b. The j-th layer has thickness h j , and storage moduli E j and G j . In the Mead-Markus model, assuming equilibrium of axial forces results in E 1h 1b
u1 u3 ⫽⫺E 3 h 3 b x x
Fig. 2 Experimental setup
(1)
where E 1 h 1 b and E 3 h 3 b are axial rigidities of the base beam and the constraining layer, respectively. Integration of Eq. 共1兲 with respect to x leads to E 1 h 1 u 1 ⫽⫺E 3 h 3 u 3 ⫹C
(2)
where C is an arbitrary function of time. In the original derivation by Mead and Markus 关1兴, it is assumed that C⫽0, resulting in u 1⫽
E 3h 3 u E 1h 1 3
(3)
Note that u 1 and u 3 are no longer independent. The presence of Eq. 共3兲 has a profound implication in that the dependence of u 1 and u 3 limits the boundary conditions allowed in the Mead-Markus formulation. Figure 2 illustrates a simple lab setup consisting of a cantilevered base beam and a free-free constraining layer. The proper boundary conditions at the left end should be
u 1 共 0,t 兲 ⫽0 x
and u 3 共 0,t 兲 ⫽0
(4)
which implies that u 1 (0,t)⫽0 for the free-free constraining layer and violates Eq. 共3兲. To incorporate these boundary conditions properly, one can modify the Mead-Markus formulation by assuming that u 1 and u 3 are independent as was done by Shen 关6兴 共and experimentally validated by Huang et al. 关7兴兲. Figure 3共a兲
Fig. 1 Displacement variable fields of the Mead-Markus model
Journal of Vibration and Acoustics
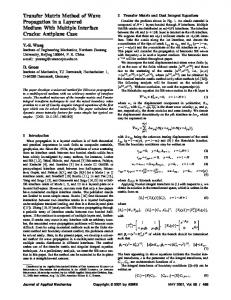
Fig. 3 „a… Predicted and experimental frequency response of a cantilevered beam „b… Error produced by a Mead-Markus model as compared to the modified theory for a cantilevered beam
APRIL 2001, Vol. 123 Õ 281
Downloaded 31 Oct 2008 to 140.112.113.225. Redistribution subject to ASME license or copyright; see http://www.asme.org/terms/Terms_Use.cfm
Table 1 Various boundary conditions for the Mead-Markus and the modified Mead-Markus formulation
Fig. 4 „a… Frequency response of a clamped A - clamped A beam. Clamped B boundary conditions were required for the original MeadMarkus formulation. „b… Error produced by a Mead-Markus model as compared to the modified theory for a clamped A - clamped A beam
282 Õ Vol. 123, APRIL 2001
Transactions of the ASME
Downloaded 31 Oct 2008 to 140.112.113.225. Redistribution subject to ASME license or copyright; see http://www.asme.org/terms/Terms_Use.cfm
Fig. 5 „a… Frequency response of a pinned A - pinned A beam. Pinned B boundary conditions were required for the original Mead-Markus formulation. „b… Error produced by a Mead-Markus model as compared to the modified theory for a pinned A - pinned A beam
shows the comparison between predictions given by the MeadMarkus formulation 共where we are forced to set u 1 (0,t) ⫽u 3 (0,t)⫽0 at the left end兲 and the modified Mead-Markus formulation, and experimental results 共both with boundary conditions at the left end given by Eq. 共4兲兲. Good agreement between the modified theory and experiments can be seen and a significant error in the first natural frequency and corresponding amplitude predicted by the Mead-Markus model can be observed. For the same boundary conditions, Fig. 3共b兲 shows the error produced by not being able to use correct boundary conditions in Mead-Markus model as compared to the modified theory. As the thickness of the viscoelastic layer was increased, it was found that the error in amplitude of the first mode increased significantly. The errors in the higher modes were found to be insignificant.
Other Boundary Conditions Many boundary conditions are compatible with the MeadMarkus formulation. Table 1 lists a range of boundary conditions, most of which can be modeled using Mead-Markus. No significant difference was detected between the predicted frequency response using Mead-Markus and the modified theory when modeling boundary conditions compatible with the Mead-Markus formulation. As soon as the boundary conditions are not compatible, however, significant error in the prediction can occur when using a Journal of Vibration and Acoustics
Mead-Markus model. Figures 4 and 5 show results for when the base beam was subjected to clamped-clamped and pinned-pinned boundary conditions and the constraining layer was free at both ends. Neither boundary condition is compatible with MeadMarkus and could therefore not be modeled using this theory without modification. The clamped-clamped case was modified such that the constraining layer was also constrained at the ends. For the second case, the pinned ends of the base beam were released such that they were free to move axially. Figures 4 and 5 show the error produced by Mead-Markus model with these modified boundary conditions as compared to using the actual boundary conditions with the modified formulation. For both types of boundary conditions, the difference between the two formulations was shown to increase significantly with decreasing thickness of the viscoelastic layer. The incompatibility of Mead-Markus with these two boundary conditions did not result in significant error in the higher modes. No appreciable difference between the two formulations was seen for mode two and higher.
Conclusions Careful attention to the boundary conditions must be exercised when predicting the behavior of the first mode using the MeadMarkus formulation. For certain boundary conditions, more accuAPRIL 2001, Vol. 123 Õ 283
Downloaded 31 Oct 2008 to 140.112.113.225. Redistribution subject to ASME license or copyright; see http://www.asme.org/terms/Terms_Use.cfm
rate results can be obtained by using a formulation that allows independent longitudinal motion of the beam and the constraining layer.
Acknowledgment
关3兴 关4兴
This material is based upon work supported by Army Research Office under agreement of No. DAAG 55-98-1-0387.
关5兴
References
关6兴
关1兴 Mead, D. J., and Markus, S., 1969, ‘‘The Forced Vibration of a Three-Layer Damped Sandwich Beam with Arbitrary Boundary Conditions,’’ J. Sound Vib., 10, No. 2, pp. 163–179. 关2兴 Markus, S., Oravsky, V., and Simkova, O., 1974, ‘‘Damping Properties of
284 Õ Vol. 123, APRIL 2001
关7兴
Sandwich Beams with Local Shearing Prevention,’’ Acustica, 31, pp. 132– 138. Rao, D. K., 1978, ‘‘Frequency and Loss Factors of Sandwich Beams under Various Boundary Conditions,’’ J. Mech. Eng. Sci., 20, No. 5, pp. 271–282. Lifshitz, J. M., and Leibowitz, M., 1987, ‘‘Optimal Sandwich Beam Design for Maximum Viscoelastic Damping,’’ Int. J. Solids Struct., 23, No. 7, pp. 1027–1034. Trompette, P., Boilot, D., and Ravanel, M. A, 1978, ‘‘Effect of Boundary Conditions on the Vibration of a Viscoelastically Damped Cantilever Beam,’’ J. Sound Vib., 60, No. 3, pp. 345–350. Shen, I. Y., 1994, ‘‘Hybrid Damping Through Intelligent Constrained Layer Treatments,’’ ASME J. Vibr. Acoust., 116, pp. 341–349. Huang, P. Y., Reinhall, P. G., and Shen, I. Y., 1999, ‘‘A Study of Constrained Layer Damping Models under Clamped Boundary Conditions,’’ Proceedings of the ASME International Mechanical Engineering Congress and Exposition.
Transactions of the ASME
Downloaded 31 Oct 2008 to 140.112.113.225. Redistribution subject to ASME license or copyright; see http://www.asme.org/terms/Terms_Use.cfm