Department of Mechanical Engineering and. Applied Mechanics, ..... tem used is a quarter car suspension system that includes a driver. ..... lished as a Report of the UM IVHS Program. 10 Rakheja, S. ... 17â20, SCS, San Diego, CA. 12 Stein ...
An Input-Output Criterion for Linear Model Deduction Douglas G. Walker Jeffrey L. Stein A. Galip Ulsoy Department of Mechanical Engineering and Applied Mechanics, The University of Michigan, Ann Arbor, MI 48109
Model order deduction algorithms have been developed in an effort to automate the production of accurate, minimal complexity models of dynamic systems in order to aid in the design of these systems. Previous algorithms, MODA and Extended MODA, deduce models independent of system inputs and outputs. FD-MODA uses frequency response methods to deduce models of a single input-output pair. In this paper, an input-output criterion based on controllability and observability is combined with the frequency based criterion used by MODA. The new model deduction algorithm, IO-MODA, compares the ratio of the adjacent diagonal values of the system gramian to a user specified threshold. The gramian is computed from a balanced realization of the system. IO-MODA generates an accurate multiple-input multiple-output model of minimum order with physically meaningful states. This model is called a proper MIMO model. An example problem is used to demonstrate this new model deduction algorithm. 关S0022-0434共00兲02103-1兴 Keywords: Automated Modeling, Proper Models, Model Reduction
1
Introduction
In order to reduce costs of the design process, engineers use mathematical system models in place of prototypes to analyze, test, and redesign their products. The engineer must find the model that is as simple as possible yet sufficiently accurate. An overly complicated model can be resource intensive and can have a large number of system parameters that make analysis and redesign difficult. In addition, obtaining these system parameters is usually a costly process. On the other hand, an overly simple model may not be sufficiently accurate. These trade-offs led Wilson and Stein 关1兴 to the concept of a proper model, a model of minimal complexity with physically meaningful states and parameters that includes all system eigenvalues within a user specified frequency range of interest 共FROI兲. Wilson and Stein developed a model order deduction algorithm 共MODA兲 that generates a proper model. Ferris et al. 关2兴 extended this idea by including a test for eigenvalue convergence. The new algorithm, Extended MODA, produces proper models of known accuracy. While MODA and Extended MODA are useful algorithms for generating proper models, neither considers how the specific choice of inputs and outputs affects the complexity of a system model. Hence, the research objective of this paper is to determine the issues underlying a proper input-output model, and develop an algorithm that will develop proper input-output models given a specific set of input and output variables.
2
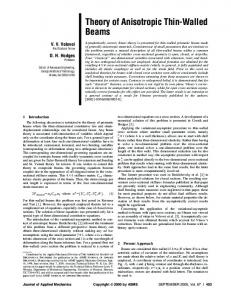
affect the states of subsystem one. If the output is a linear combination of states from subsystem one, the second subsystem can be dropped from the model. For these two examples, the models produced by MODA and Extended MODA would include elements that are not necessary. In the first example, they would include all the modes that have a natural frequency within the FROI and thus all the unnecessary even modes would be inappropriately included. In the second example, MODA and Extended MODA would unnecessarily include the degrees of freedom associated with both mass 1 and mass 3 provided the natural frequency of each subsystem fell within the FROI. MODA and Extended MODA do not take advantage of the input-output relationships that may help reduce the complexity of the model. Wilson et al. 关3兴 use a frequency domain, model order deduction algorithm 共FD-MODA兲 to deduce a proper model of a single-input, single-output linear system. FD-MODA uses the maximum deviation of the computed frequency response of a candidate model of higher complexity from a baseline model to deduce the proper single-input, single-output model. However, in order to deduce the proper multiple-input, multiple-output model, FD-MODA would have to be used for every inputoutput combination. Furthermore, computing and comparing multiple frequency responses can be relatively computationally intensive. It is known that, in linear systems, the choice of inputs and outputs affects the controllability and observability properties of systems. It is proposed, therefore, to add a check of the control-
Background
It is well known that the location of an input or an output affects model selection. For example, consider a simply supported Euler-Bernoulli beam with the transverse deflection at the beam’s center as the output. Because the even modes of beam have a point of zero deflection at the center, the even modes can be dropped from the model. As an additional example, consider the multiple mass spring system in Fig. 1 and assume that spring K s is rigid. Because spring K s is rigid the input F will not affect the states of subsystem two and the states of subsystem two will not Contributed by the Dynamic Systems and Control Division for publication in the JOURNAL OF DYNAMIC SYSTEMS, MEASUREMENT, AND CONTROL. Manuscript received by the Dynamic Systems and Control Division August 6, 1996. Associate Technical Editor: G. Rizzoni.
Fig. 1 Multiple spring mass system
Journal of Dynamic Systems, Measurement, and Control Copyright © 2000 by ASME
SEPTEMBER 2000, Vol. 122 Õ 507
lability and observability of candidate system models to the existing model order deduction algorithms 共MODA and Extended MODA兲 to deduce proper multiple input, multiple output models. This technique takes advantage of the properties of linear systems that lend themselves to computationally efficient matrix manipulations.
3 An Input-Output Model Order Deduction Algorithm „IO-MODA… 3.1 Controllability and Observability: A Model Selection Criteria. Assuming an accurate model already exists, the states of a system model can be divided according to controllability and observability properties using the controllable-observable decomposition, Kailath 关4兴. Only states that affect the input-output behavior of the system are controllable and observable states. If the system is stable, one can reduce the complexity of the model by retaining only the controllable and observable states and be guaranteed that the reduced system is stable. The controllable-observable decomposition works well for ideal systems like the beam and spring mass example of the previous section. However, most systems do not have completely uncontrollable or unobservable states. Suppose the output in the beam example is the transverse deflection a small distance ␦ away from the center. Now the even modes provide a small contribution to the output, and the decision to neglect the even modes is less clear. Similarly, suppose spring K s in Fig. 1 is not rigid, but still very stiff. If the output is a linear combination of states in subsystem one, the states of subsystem two will have an impact on the states of subsystem one but it may not be large. The decision to neglect subsystem two is now less clear. Moore 关5,6兴 introduces the balanced realization of a stable, linear, time invariant system to determine which states of a system are nearly uncontrollable or nearly unobservable. According to Shokoohi et al. 关7兴, the nearly uncontrollable and nearly unobservable states are nearly redundant and can safely be eliminated as long as the full system model is stable. Therefore, model reduction can be achieved through a balanced realization. While the balanced realization provides a model reduction method that is input-output specific, it presupposes the existence of a mathematical model, and therefore by itself it is not useful for model deduction. It is proposed in this paper, therefore, to combine the balanced realization with Extended MODA to form a new model deduction algorithm, IO-MODA. 3.2 Description of Algorithm. IO-MODA deduces the minimum complexity model with physically meaningful states and parameters for linear, stable, time-invariant systems. IOMODA divides the model deduction process into the same two stages used by Extended MODA. The first stage determines the set of critical system eigenvalues 共CSEs兲 and the second stage increases model complexity until the CSEs converge within some specified tolerance. In the first stage of the algorithm, however, a check for observability and controllability is added. 3.2.1 Determining the Critical System Eigenvalues. Extended MODA defines the critical system eigenvalues as all the system eigenvalues that lie within the FROI plus the eigenvalue pair that lies just outside the FROI. For IO-MODA, the set of critical system eigenvalues only includes the controllable and observable system eigenvalues within the FROI and possibly the pair just outside the FROI. Any eigenvalues that are nearly uncontrollable or nearly unobservable will not have a large affect on the system response because they will be nearly canceled by zeros. IO-MODA uses an iterative process similar to Extended MODA that increments the component ranks 共Wilson and Stein 关1兴兲 until the system model includes all the CSEs. The rank of a system is a measure of the complexity, and, in purely resonant systems, is equivalent to the number of degrees of freedom or 508 Õ Vol. 122, SEPTEMBER 2000
number of modes. The system rank is equal to the sum of the component ranks. Each iteration of IO-MODA starts with a baseline model made up of component models that may vary in rank 共i.e., complexity兲. The first iteration, i⫽1, starts with the rank 0 system model composed of the rank 0 component models. To determine which component rank to increase, IO-MODA produces a set of N i candidate system models each with a system rank one greater than the baseline model’s system rank. The number of candidate models of the first iteration, N 1 , is equal to the number of components in the system, while the number of component models in later iterations, N i , may be less than N 1 as component models begin to posses their maximum rank in the subsequent baseline models. Each candidate model has the same component ranks as the components in the baseline model except for one component whose rank is increased by one. The subscript j in the following equations will denote the jth candidate model where j⫽1,2, . . . ,N i . Once the candidate models are determined the state space equations are computed for each candidate model. These state equations must be written in the form x˙ i j ⫽A i j x i j ⫹B i j u
(1)
y ⬘ ⫽C i j x i j ⫹D i j u where x i j is the state vector of length n i ⫽2i for the jth candidate model of the ith iteration, u is the input vector of length r 共number of inputs兲, y ⬘ is the output vector of length m 共number of outputs兲 and A i j is rank n i and Hurwitz, otherwise IO-MODA is not applicable. Note that the state equations include, in addition to A i j , the B i j , C i j , and D i j matrices since input and output variables are specified. The next step of the algorithm is to check the observability and controllability properties of each candidate using the balanced realization which assumes the state equations are in the form x˙ i j ⫽A i j x i j ⫹B i j u
(2)
y⫽C i j x i j The linear combination of the inputs, the Du terms, in Eq. 共1兲 have no effect on the controllability or observability properties of the states and thus can be algebraically removed by defining a new output y such that y⫽y ⬘ ⫺D i j u
(3)
The balanced realization also assumes (A i j ,B i j ) is controllable and (A i j ,C i j ) is observable. If this is not the case, the candidate model has completely uncontrollable or unobservable states and can obviously be eliminated. A system has completely uncontrollable 共unobservable兲 states if its controllability 共observability兲 gramian is less than full rank. Computation of the controllability 共observability兲 gramian is discussed later in this section. Before the system is balanced, the B i j and C i j matrices are normalized by dividing each column 共row兲 by its own norm such that
B i j ⫽ 关 b i j1 b i j2 ¯ b i j p 兴
Ci j⫽
再冎 c iTj1 c iTj2 ] c iTjq
冦冧
(4)
c iTj1
冋
¯B ⫽ b i j1 b i j2 ¯ b i j p ij 储 b i j1 储 储 b i j2 储 储 b i j p 储
册
储 c iTj1 储 c iTj2
¯ ⫽ C ij
储 c iTj2 储 ] c iTjq 储 c iTjq 储
Transactions of the ASME
Normalization of the inputs and outputs prevents any input-output pair from being numerically dominant. Scaling the B i j and C i j matrices is equivalent to changing the units which has no effect on the dynamic properties of the system. To check the controllability and observability properties of the candidates, each stable system is put into the balanced realization and its gramian is computed. The balanced realization is merely the state transformation such that Aˆ i j ⫽T i j ¯A i j T i⫺1 j
¯ T ⫺1 Cˆ i j ⫽C ij ij
Bˆ i j ⫽T i j ¯B i j
(5)
where the transformation matrix T i j is found using the methods proposed by Moore 关6兴 such that the controllability and observability gramians are identical. For time invariant linear systems, the controllability and observability gramians are given, respectively, by W ci j ⫽
冕 冕
t
ˆ ˆT e A i j Bˆ i j Bˆ iTj e A i j d
0
W oi j ⫽
t
(6) ˆT
ˆ
e A i j Cˆ iTj Cˆ i j e A i j d
0
The solution to Eq. 共6兲 can be reduced to the solution of the following algebraic Lyapunov equations. Aˆ i j W ci j ⫹W ci j Aˆ iTj ⫹Bˆ i j Bˆ iTj ⫽0
(7)
Aˆ iTj W oi j ⫹W oi j Aˆ i j ⫹Cˆ iTj Cˆ i j ⫽0 For a balanced realization, the controllability and observability gramians are identical (W ci j ⫽W oi j ⫽W i j ) and diagonal and each is given by
Wi j⫽
冋
i2j1
0
0
i2j2
] 0
¯
¯
0 ]
�
0
0
i2jn
册
(8)
where i jk are the diagonal values of the gramian, and i jk ⬎ i j ( k⫹1 ) for all k⫽1,2, . . . ,n. Shokoohi et al. 关7兴 explain the meaning of these values from an energy standpoint. The inverse of the kth diagonal value of the gramian W i j , 1/ i jk , represents the power needed to drive the kth state from 0 to 1. Also, the power from the kth state seen at the output of the system is equal to i jk . If i jk is 10 times greater than i j ( k⫹1 ) , then the kth state is 10 times more observable and controllable than the (k⫹1)th state. Thus, the ratio between any adjacent entries on the diagonal can be compared to a user specified tolerance . 1 i jk ⬎ i j 共 k⫹1 兲
k⫽1,2, . . . , 共 n i ⫺1 兲
(9)
Based on Eq. 共9兲, some of the states in a candidate model can be considered nearly unobservable and nearly uncontrollable and, therefore, nearly redundant. If a candidate model has nearly redundant states, then the additional complexity added to the system adds little or no information to the input-output behavior of the baseline system. The additional eigenvalues added to the system will be nearly canceled by zeros, and the transfer function of the candidate model will essentially reduce to the transfer function of the baseline model. Therefore, any stable candidate model with nearly redundant states can be eliminated from the set of candidates. The number of models eliminated by the controllability and observability check in the ith iteration is denoted by E i . Next, the algorithm calculates the spectral radius,
i j ⫽max共 储 i jk 储 兲
k⫽1,2, . . . ,n i
(10)
k
Journal of Dynamic Systems, Measurement, and Control
of the remaining candidate models and selects the model that produces the smallest increase in spectral radius. If the spectral radius of the selected model is larger than the frequency range of interest 共FROI兲, i.e., if
i ⫽min共 i j 兲 ⬎FROI
j⫽1,2, . . . , 共 N i ⫺E i 兲
(11)
j
or if all candidate models have been eliminated, i.e., if N i ⫺E i ⫽0
(12)
then all the CSEs have been found and the algorithm proceeds to the second 共convergence兲 stage. If the spectral radius of the selected model is not greater than the FROI then the selected model becomes the baseline model for the next iteration, i⫽i⫹1. 3.2.2 Convergence of the Critical System Eigenvalues. Once the CSEs have been determined, the complexity of the model is increased until the CSEs have converged within some specified tolerance 共␣兲. This procedure is identical to Ferris et al. 关2兴 and is reviewed here briefly. A set of N i candidate models is created in the same fashion as described in the last section. The eigenvalues are computed for each candidate model, and the change in each CSE from the previous model is determined such that ⌬CSEi jk ⫽ 兩 i jk ⫺CSEk 兩
k⫽1,2, . . . ,n CSE
(13)
where CSEk is the kth critical system eigenvalue from the previous model and n CSE is the number of critical system eigenvalues. The algorithm computes the maximum change in the CSEs for each model, ⌬CSEi j ⫽max共 ⌬CSEi jk 兲
k⫽1,2, . . . ,n CSE
(14)
k
and selects the candidate model with the greatest ⌬CSE as the new baseline model. This process repeats itself until the greatest maximum change in the CSEs is less than some user specified tolerance, such that max共 ⌬CSEi j 兲 ⬍ ␣
j⫽1,2, . . . , 共 N i ⫺E i 兲
(15)
j
3.2.3 Summary of IO-MODA. The first stage of IO-MODA is summarized in the following steps: 1 Start with the rank 0 system model 共rigid body model兲 as a baseline, and set i⫽1. 2 Generate the set of N i candidate system models with rank one greater than the baseline. 3 Generate the state equations in the form of Eq. 共1兲 for each candidate model. 4 Normalize the state equations with Eq. 共4兲, and transform the equations into the balanced realization with Eq. 共5兲. 5 Calculate the gramian for each candidate with Eq. 共7兲. 6 Check the observability and controllability of each candidate using Eq. 共9兲. Eliminate all stable, nearly uncontrollable and nearly unobservable candidate models. Determine E i . 7 Calculate the spectral radius, i j , for each remaining candidate with Eq. 共10兲. 8 Select the candidate system model with the smallest increase in spectral radius as the new baseline. 9 Compare the spectral radius with the FROI, Eq. 共11兲. If គ i is less than the FROI, then go to step 2 and begin a new iteration, i⫽i⫹1. If គ i is greater than the FROI or N i ⫺E i ⫽0, then go on to the second stage of the algorithm. The second stage of IO-MODA is summarized in the following steps: SEPTEMBER 2000, Vol. 122 Õ 509
1 Start with the model selected by the first stage as the baseline and calculate the CSEs. 2 Generate the set of N i candidate models with rank one greater than the baseline. 3 Generate the equations of motion in the form of Eq. 共1兲 for each candidate and calculate the eigenvalues for each candidate. 4 Calculate the change in the CSEs with Eq. 共13兲, for each candidate model. 5 Calculate the maximum ⌬CSE for each model using Eq. 共14兲. 6 Check the convergence with Eq. 共15兲. If the CSEs have not converged, select the model with the greatest ⌬CSE as the new baseline and go to step 2 for a new iteration, i⫽i⫹1. If the CSEs have converged, the algorithm ends.
4
Example Problem
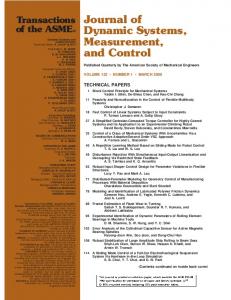
4.1 Description. The purpose of this example is to show how the proper model of a system can be chosen uniquely with the procedure outlined in the previous section. The example system used is a quarter car suspension system that includes a driver. The objective is to create three models, the first to predict the deflection of the tire as a function of the road inputs, the second to predict the accelerations at the driver’s head in response to the road inputs, and the third to predict both the tire deflection and the accelerations at the driver’s head in response to the road inputs. It is assumed that each model is required to be accurate over the same frequency range. The input to the system is the velocity profile of the road. This system, shown in Fig. 2, is composed of five components: tire, suspension, seat, lower body, and upper body. The component models are also shown in Fig. 2. The complexity of a component model can vary from the simplest, the rank 0 component model which only includes the mass, to the most complicated, the rank 1 model for all components except the suspension model whose maximum rank is 2. In this example, the difference between the rank 0 and rank 1 models is the inclusion of the component’s viscoelastic properties. For the suspension, the viscoelastic properties are related to two different features of the component, namely the main springs and shock absorbers 共denoted by k s , k a , and c a 兲 and the bushings 共denoted by k b and c b 兲1 The quarter car model and parameters were taken from Ben Mrad et al. 关8兴 and Ulsoy 关9兴. The driver model and parameters were taken from Rakheja et al. 关10兴. All parameter values are listed in the Appendix. For this example, the FROI is specified as 100 rad/s, the eigenvalue convergence tolerance, ␣, is 0.1, and the controllability-observability tolerance, , is 0.122. 4.2
Fig. 2 System, component models, and full system model
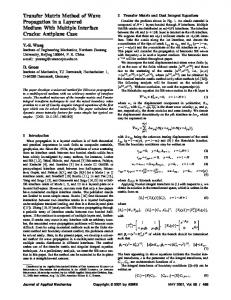
model for each candidate model. The first baseline model is determined by setting the system model to rank 0 共i.e., only including the rank 0 component models兲. At iteration 1 in Fig. 3, there are 5 candidate models. A dotted line in Fig. 3 represents an interim increase in the component’s rank during assembly of candidate models. When a candidate model is selected as the baseline model for the next iteration or when a candidate model is eliminated, the line representing the rank of the associated component turns solid because that component’s rank has been specified in the new baseline model. For this example, only the candidate model associated with the tire component passes the controllability and observability check in the first iteration. Figure 3 shows this by keeping the rank of the tire at 1 and dropping the other component ranks to 0. Next, at the point marked , the spectral radius of the remaining candidate models is calculated and the candidate model which causes the smallest change in the system spectral radius is selected. In this example, the candidate model associated with the tire component is selected as the new baseline in the first iteration. Figure 3 shows this by keeping the rank of the tire at 1. At the end of the first iteration, the system rank, which is the sum of the component ranks, is 1.
Results
4.2.1 Output: Tire Deflection. Figure 3 shows the progression of the first stage of IO-MODA when the specified output is the tire deflection. The component ranks and the system rank 共which is equal to the sum of the component ranks兲 are plotted against the iterations of the algorithm 共the index i兲. Each iteration on the graph is divided by the points marked c/o and which represent the controllability-observability check and the spectral radius check, respectively. In the beginning of each iteration, IOMODA creates a set of N i candidate models such that the rank of only one component is incremented above its rank in the baseline 1 Note: These simple representations of the component’s complexities are made for the convenience of this example which is to show how system model complexity can be determined automatically based on input output information and a FROI. Component templates with a large range of model complexity can be handled by Extended MODA 共see Ferris and Stein 关2兴兲 and thus, by IO-MODA as well. 2 A smaller value of will tend to include more components and produce a more accurate system model. A larger value of will likely result in a simpler model with a trade off of less accuracy. Selection of for a given eigenstructure accuracy has not been explored. For this example, was chosen based on trial and error, comparisons of the deduced models to the full system model, and insight of the system’s dynamic behavior.
510 Õ Vol. 122, SEPTEMBER 2000
Fig. 3 Progression of algorithm for tire deflection
Transactions of the ASME
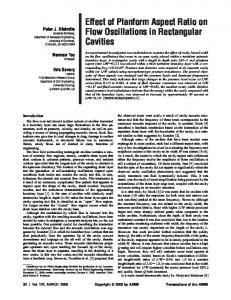
Fig. 4 Pole-zero plots for tire deflection
Because the spectral radius of the new baseline model is less than the FROI, the algorithm starts a second iteration (i⫽2). The iteration starts by increasing the rank of each component except the tire because the tire has already reached its maximum rank of 1. The rank of each component is incremented in Fig. 3 to specify the creation of the candidate models for the second iteration. However, in the second iteration only the candidate model associated with the suspension passes the controllabilityobservability test. All other component ranks return to their baseline values 共e.g., rank 1 for the tire and rank 0 for the seat兲. The candidate model associated with the suspension component is retained. It is then tested by the spectral radius check, it passes, and thus is selected as the new baseline model. Thus, Fig. 3 shows the rank of the suspension model remains at 1. The system rank is now 2. The spectral radius check of the system model reveals that the spectral radius is still less than the FROI, so the algorithm starts a third iteration. The iteration starts by increasing the rank of each component except the tire. None of the rank 3 candidate models pass the controllability-observability test. Because no candidate models remain, the first stage ends. The second stage of the algorithm, to cause the critical system eigenvalues to converge, adds no complexity to the model due to the large tolerance set on eigenvalue convergence. Thus, IO-
Fig. 5 Frequency response for tire deflection
Journal of Dynamic Systems, Measurement, and Control
Fig. 6 Progression of IO-MODA for acceleration of upper mass
MODA deduces a rank 2 system model for the given output and user specified tolerances. The proper input-output model only includes the rank 1 tire model and the rank 1 suspension model. Thus, IO-MODA deduces a model that has only two degrees of freedom compared to the full model that has six degrees of freedom. Note that the full model is also the model deduced by Extended MODA for the same FROI and ␣. Thus the input and output chosen for this system has a profound impact on the complexity of the model. As a way to illustrate the IO-MODA model versus the full model a pole-zero plot of each model is shown in Fig. 4. The ‘‘extra’’ poles 共x兲 in the full model are nearly canceled by zeros 共o兲, and the remaining poles are nearly the same as the poles in the model deduced by IO-MODA. Figure 5 compares the frequency responses of the two models. The frequency response of the model deduced by IO-MODA matches the frequency response of the full model well over the frequency range of interest.
Fig. 7 Pole-zero plots for upper body acceleration
SEPTEMBER 2000, Vol. 122 Õ 511
response for the new model plotted along with the frequency response of the full model. Again note the strong agreement between the two models. 4.2.3 Outputs: Tire Deflection and Upper Body Acceleration Figure 9 shows the progression of the first stage of IO-MODA when the system outputs are the tire deflection and the acceleration of the upper mass. The proper input-output model for these outputs is the same as the proper input-output model when the output is only the acceleration of the upper body. This shows that as expected, the proper input-output model for the two outputs is the union of the proper input-output models deduced separately.
5
Fig. 8 Frequency response for upper body acceleration
4.2.2 Output: Upper Body Acceleration. Figure 6 shows the progression of the first stage of IO-MODA when the output is the acceleration of the upper body. The result for this output is a rank 5 system model that includes all compliances except the bushing. The second stage of the algorithm adds no complexity to the model. In this example, while some of the candidate models are eliminated during a particular iteration by the controllability and observability check, eventually all components 共except the bushing elements in the suspension兲 are needed. This means that near pole-zero cancellations that occur in some of the simpler candidate models do not occur as the complexity is increased systematically. Figure 7 shows the pole-zero plots for the full model and the model deduced by IO-MODA when the output is the acceleration of the upper body. With this output, the poles of the system are not nearly canceled by zeros. Figure 8 shows the frequency
Fig. 9 Progression of IO-MODA for both outputs
512 Õ Vol. 122, SEPTEMBER 2000
Discussion
For the example when the output is tire deflection, IO-MODA selects a model that only includes the suspension elements 共without the bushing兲 and the tire elements. This is a large reduction in complexity from the model selected by Extended MODA. In contrast, when the output is the acceleration of the upper mass, IOMODA selects a model that is the same as the model selected by Extended MODA less the bushing elements. These two cases show how the complexity of the proper input-output model is dependent on the specific choice of output. Another difference between the two cases is the relative importance of the model selection criteria in the model deduction process. In the tire deflection example, the controllabilityobservability criterion determines the new baseline model each iteration since only one candidate model passes the controllability-observability check in the first two iterations. When the output is the acceleration of the upper mass, the majority of the candidate models pass the controllability-observability check and the spectral radius check determines the new baseline model each iteration. Intuitively, these results make sense. When the output is the tire deflection the upper body mass, the lower body mass, and the seat mass contribute little to the output. In other words, the reaction of the driver to road inputs will produce a very small force on the tire compared to the car body and the suspension. However, when the output is the acceleration of the upper mass, one expects almost all the elements between the input and the output to have a significant effect. When multiple inputs and/or outputs are specified, the desired result is the union of all possible single input, single output models. This is illustrated by the example. This result insures that each input-output path is at least as accurate as the specified tolerances. For certain inputs and outputs IO-MODA reduces the complexity of the model considerably. The deduced model, however, is only ‘‘good’’ for the specified frequency range and the specified inputs and outputs. Clearly, using a system model deduced for a different set of inputs and outputs may produce misleading results. In a similar fashion, as with MODA and Extended MODA, using a model deduced by IO-MODA for a specific frequency range of interest to study behavior at frequencies above the specified frequency range of interest, may also produce inaccurate results. As has been previously reported for MODA and Extended MODA, IO-MODA is an algorithm that could be easily implemented in an automated modeling environment. This environment will facilitate engineers in the modeling/design process. MODA and Extended MODA have already been implemented in computer software with the development of Model Building Assistant 共MBA兲 which automates MODA 共Wilson and Stein 关11兴兲 and the Computer Aided Model Building Automation System 共CAMBAS兲 which automates MODA and Extended MODA 共Stein and Louca 关12兴兲. Since IO-MODA is similar in structure to Extended MODA, automation of IO-MODA would involve only a few modifications to CAMBAS. The major difference between Extended MODA and IOMODA is the addition of a controllability-observability check. In Transactions of the ASME
the previous section describing IO-MODA, each iteration of the first stage checks the controllability-observability of each candidate model first and the spectral radii of the remaining candidates second. Reversing the order of these two checks produces the same result. When the order is reversed, the algorithm calculates the spectral radius of all the candidate models, and the candidate models are ordered according to their spectral radius, from smallest to largest. Then the algorithm checks the controllabilityobservability of the candidate models in order, starting with the candidate model that has the smallest spectral radius. The first model that passes the controllability-observability check is selected as the new baseline and the algorithm moves on to the next iteration. With the order reversed, each iteration of the first stage computes the spectral radius 共eigenvalues兲 of each candidate model, but may select the new baseline model before checking the controllability-observability of every candidate model. In the original order, the controllability-observability is checked for every model, but the spectral radius is only calculated for the models that pass the controllability-observability criteria. Because calculating the balanced realization for the controllability-observability check is more computationally intensive than calculating the eigenvalues, the reverse order should be employed to obtain a more computationally efficient algorithm. In order to emphasize the value of a model deduction algorithm rather than a model reduction algorithm consider the following. It is possible to combine the balanced realization with Extended MODA to find a reduced model. First a proper model would be deduced with Extended MODA then the state equations would be balanced to remove the nearly unobservable and nearly uncontrollable states. This method is more efficient than IO-MODA since only one set of balanced state equations is required. However, the resulting model contains transformed states that are not physically meaningful. IO-MODA deduces a model with physically meaningful states because it uses the balanced realization to eliminate possible system models not to eliminate states from any particular system model. IO-MODA uses the balanced realization as a model deduction tool not as a model reduction tool.
Nomenclature CSEk ⫽ kth critical system eigenvalue of the baseline model E i ⫽ number of candidate models eliminated by the controllability-observability check in the ith iteration FROI ⫽ frequency range of interest N i ⫽ number of candidate models in the ith iteration T i j ⫽ balancing transformation matrix W i j ⫽ gramian matrix of the jth candidate model of the ith iteration i ⫽ index denoting iteration number j ⫽ index denoting candidate model n CSE ⫽ number of critical system eigenvalues n i ⫽ number of states for candidate models in the ith iteration ␣ ⫽ convergence tolerance ⌬CSEi j ⫽ maximum change in critical system eigenvalue of the jth candidate ⌬CSEi jk ⫽ change in the kth critical system eigenvalue ⫽ separation tolerance i jk ⫽ the kth system eigenvalue of the jth candidate model of the ith iteration គ i ⫽ spectral radius of the model selected by the ith iteration i j ⫽ spectral radius of the jth candidate model of the ith iteration i jk ⫽ the kth diagonal value of the gramian for the jth candidate model of the ith iteration
Appendix: Model Parameters k t ⫽185549 k s ⫽15555
k c ⫽2392.7
k d ⫽14728.4
k a ⫽3000 k b ⫽800000
c t ⫽59
6
Summary and Conclusions
This paper describes a new algorithm, IO-MODA, that deduces a proper input-output model 共a model of minimal complexity with physically meaningful states and parameters兲 accurate over a frequency range of interest 共FROI兲 for a specific set of inputs and outputs. This new algorithm is achieved by adding an input-output criterion based on the controllability and observability principles to an existing model deduction algorithm, Extended MODA. A balanced realization is utilized to check controllability and observability. When multiple inputs and outputs are specified, IOMODA deduces an input output model that is the union of all proper single-input-single-output models. This model is considered minimal for the specified inputs and outputs over the user specified frequency range of interest. A simple illustrative example is used to demonstrate the behavior of the algorithm and the radically different models that can be deduced depending on the choice of outputs. This algorithm is an extension, in structure, of previous algorithms that have been implemented in automated modeling software. Thus, IO-MODA should be a useful automated modeling algorithm.
Acknowledgment The authors gratefully acknowledge the support of this work from the U.S. Army Tank Automotive Command 共ARC DAAE 07-94-Q-BAA3兲 through the Automotive Research Center, University of Michigan. In addition, the technical support of Ms. Mikell Eiler of TACOM and Roy Davis of Ford Motor Co. is gratefully acknowledged.
Journal of Dynamic Systems, Measurement, and Control
c c ⫽364.7
c d ⫽145.9
c a ⫽1772
k e ⫽70000
c e ⫽150
m us ⫽47
c b ⫽4000
m a ⫽8 m e ⫽14.62
m c ⫽29.25 m d ⫽5.85
m s ⫽420.28
References 关1兴 Wilson, B. H., and Stein, J. L., 1995, ‘‘An Algorithm for Obtaining Proper Models of Distributed and Discrete Systems,’’ ASME J. Dyn. Syst., Meas., Control, 117, No. 4, pp. 534–540. 关2兴 Ferris, J., Stein, J. L., and Bernitsas, M., 1998, ‘‘Development Of Proper Models of Hybrid Systems,’’ ASME J. Dyn. Syst., Meas., Control, 120, No. 3, pp. 328–333. 关3兴 Wilson, B. H., Taylor, J. H., and Eryilmaz, B., 1995. ‘‘A Frequency Domain Model-Order-Deduction Algorithm for Linear Systems,’’ ASME Winter Annual Meeting, Proceedings of the Symposium on Automated Modeling for Design, San Francisco, CA., Nov. 12–17, ASME, New York, NY. 关4兴 Kailath, T., 1980, Linear Systems, Prentice Hall, Englewood Cliffs, NJ. 关5兴 Moore, B. C., 1978, ‘‘Singular Value Analysis of Linear Systems,’’ Proceedings IEEE CDC, pp. 66–73. 关6兴 Moore, B. C., 1981, ‘‘Principal Component Analysis in Linear Systems: Controllability, Observability and Model Reduction,’’ IEEE Trans. Autom. Control, AC-26, pp. 17–32. 关7兴 Shokoohi, S., Silverman, L. M., and Van Dooren, P. M., 1983, ‘‘Linear TimeVariable Systems: Balancing and Model Reduction,’’ IEEE Trans. Autom. Control, AC-28, pp. 810–822. 关8兴 Ben Mrad, R., Levitt, J. A., and Fassois, S. D., 1991, ‘‘A Nonlinear Model of an Automobile Hydraulic Active Suspension System,’’ ASME Adv. Autom. Technol., DE-vol. 40, pp. 347–359. 关9兴 Ulsoy, A. G., 1992, Lecture Notes for ME568: Vehicle Control Systems, Published as a Report of the UM IVHS Program. 关10兴 Rakheja, S., Afework, Y., and Sankar, S., 1994, ‘‘An Analytical and Experimental Investigation of the Driver-Seat-Suspension System,’’ Vehicle System Dynam., 23, pp. 501–524. 关11兴 Wilson, B. H., and Stein, J. L., 1993, ‘‘Model-Building Assistant: An Automated Modeling Tool for Machine-Tool Drive Systems,’’ Proceedings of the 1993 International Conference on Bond Graph Modeling and Simulation La Jolla, CA, Jan. 17–20, SCS, San Diego, CA. 关12兴 Stein, J. L., and Louca, L., 1995, ‘‘A Component Based Modeling Approach for System Design: Theory and Implementation,’’ Proceedings of the 1993 International Conference on Bond Graph Modeling and Simulation, Las Vegas, NV, Jan. 15–18, SCS, San Diego, CA.
SEPTEMBER 2000, Vol. 122 Õ 513